EU Nuclear New-Build & Supply-Chain Market 2026–2030: Serial Build Reality, Long-Lead Constraints, and Where Bankable Delivery Actually Forms
Report Description
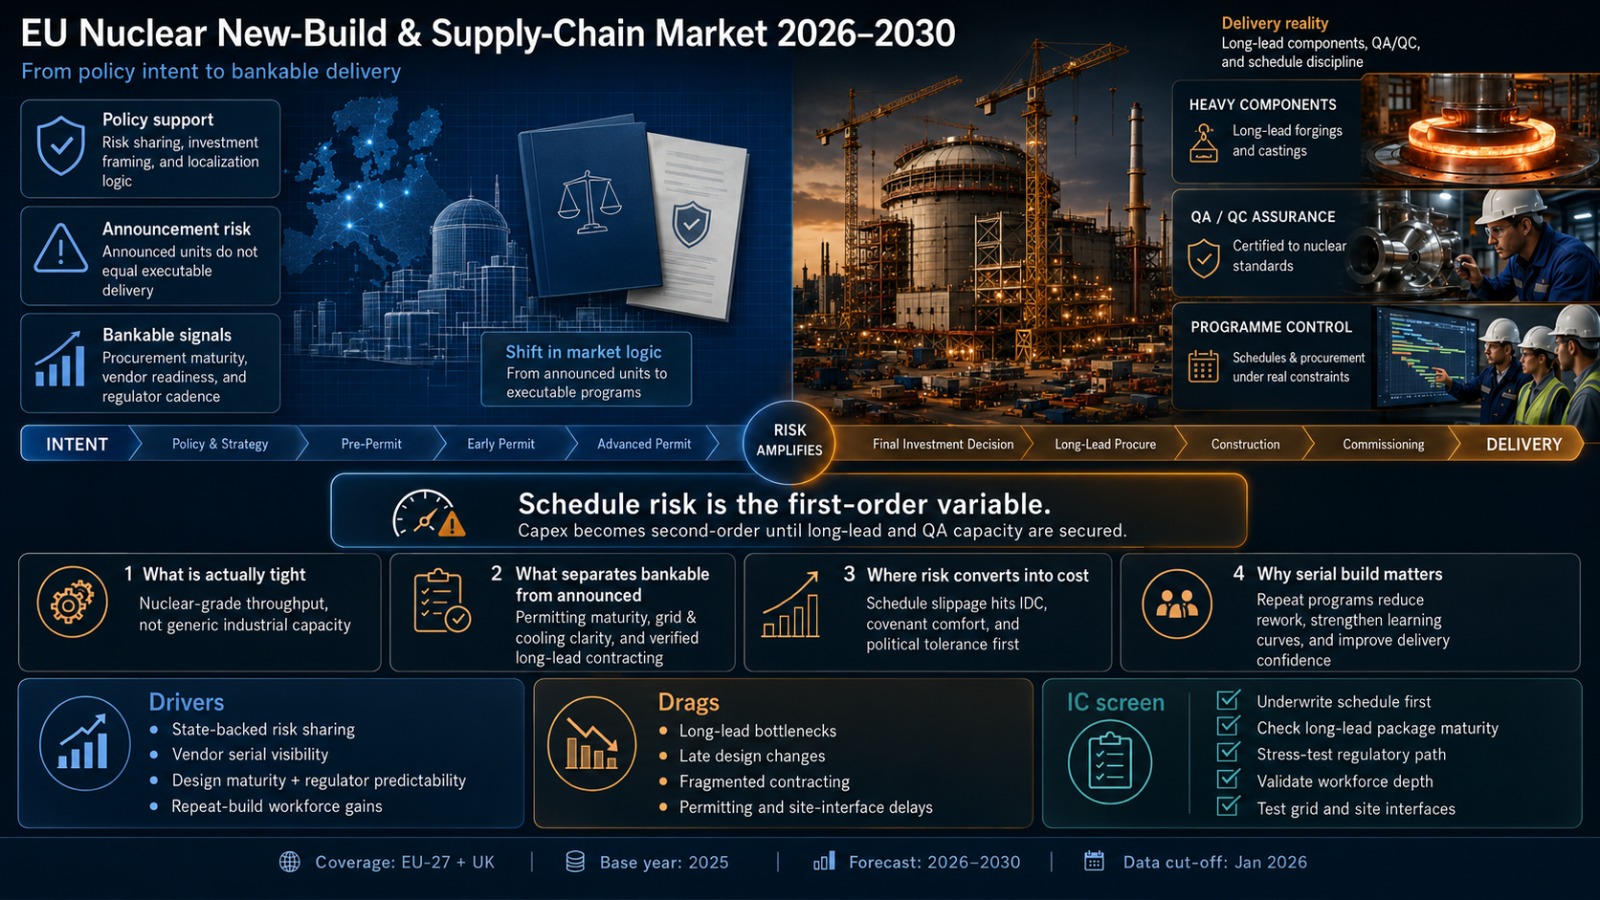
EU Nuclear New-Build & Supply-Chain Market 2026-2030 is shifting from a policy argument to a delivery argument, and that shift is already visible in how projects are being underwritten, contracted, and de-risked across the EU-27 + UK. The market’s center of gravity is not “how many units get announced,” but which programs can convert political intent into serial execution while preserving quality and regulatory confidence. The practical constraint sits in the supply chain’s nuclear-grade throughput, where qualification, documentation, and workforce depth set the tempo, and that tempo determines whether financing remains credible when timelines stretch.
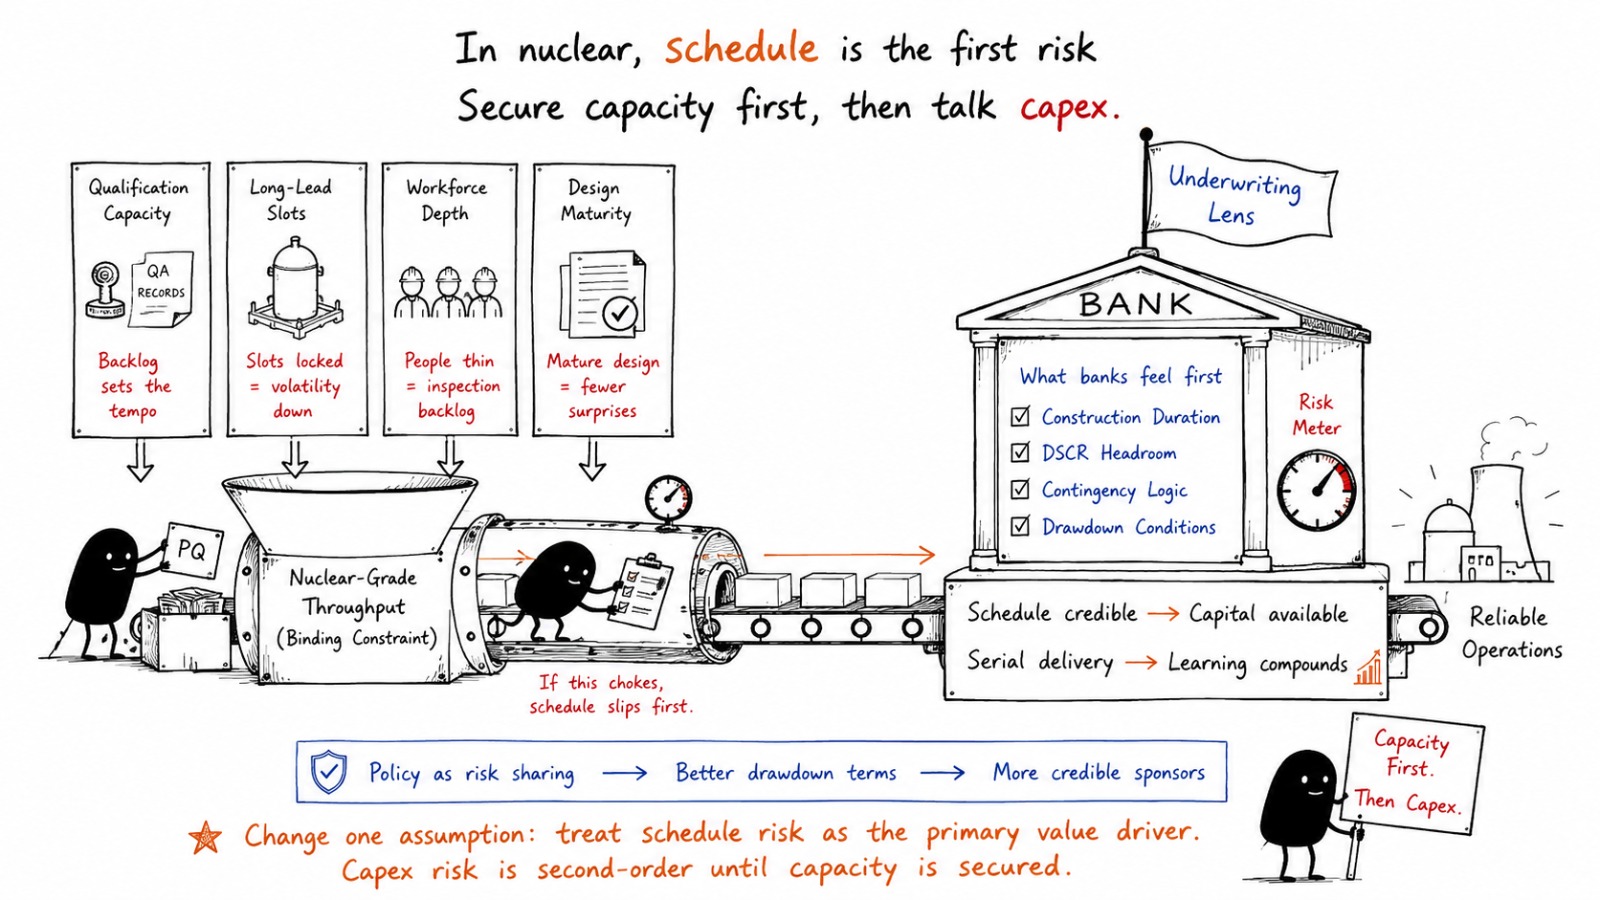
Mainstream forecasts often treat cost as the dominant uncertainty, but in this cycle schedule is the first-order variable because it is where nuclear safety culture meets industrial reality and where banks feel risk earliest through DSCR headroom, contingency logic, and drawdown conditions. Capital is moving toward structures that price construction duration explicitly, toward delivery models that concentrate accountability, and toward programs that can prove vendor readiness rather than merely cite OEM capability. The signal set that matters is dull but decisive: procurement package maturity, vendor qualification backlogs, regulator interaction cadence, and the credibility of long-lead component slots.
If you only change one assumption in your model, change: treat schedule risk as the primary value driver and capex risk as second-order until long-lead and QA capacity is secured.
Key Insights
- 1When nuclear-grade qualification capacity is the binding constraint, schedules drift before budgets explode, which shows up in covenant tightening and changes what “bankable progress” means.
- 2When long-lead slots are secured with credible design maturity, procurement volatility falls and this shows up as fewer commissioning surprises, which strengthens the underwriting case even without perfect capex clarity.
- 3When contracting fragments interfaces, defects surface late and this shows up as rework under QA hold points, which turns commissioning into the real cost center and shifts bank risk appetite.
- 4When workforce depth is thin, productivity drops and this shows up as inspection backlogs and documentation debt, which increases schedule risk more reliably than commodity price moves.
- 5When policy support arrives as structured risk sharing, financing becomes more durable and this shows up in improved drawdown conditions, which changes who can credibly sponsor projects.
- 6When localization targets ignore true bottlenecks, risk is not reduced and this shows up as “local content met” alongside procurement delays, which forces a reset in industrial policy priorities.
- 7When regulator interaction is treated as a process discipline rather than an event, predictability improves and this shows up in fewer late licensing shocks, which stabilizes schedules and financing cases.
- 8When commissioning readiness is built into contracting and documentation early, availability risk drops and this shows up in smoother handover, which matters more to operators than marginal construction speed.
- 9When programs behave like serial systems rather than one-off megaprojects, learning compounds and this shows up in reduced rework cycles, which is where durable competitive advantage forms.
Scope of the Study
Above-the-Fold Snapshot
-
Market boundary: New-build reactor delivery plus the enabling supply chain (long-lead components, QA/QC, codes and standards, workforce, fuel services interface).
-
What is actually tight: Capability that passes nuclear quality regimes, not generic industrial capacity, and this tightness shows up as procurement lead-time inflation and vendor qualification queues.
-
Where risk converts into cost: Schedule slippage hits IDC, covenant comfort, and political tolerance before it hits EPC headline capex.
-
What separates bankable from “announced”: Permitting maturity, grid and cooling interface clarity, and a verified contracting path for forged components, I&C, and qualified civil works.
Why do forecasts go wrong in the EU nuclear new-build and supply-chain market?
Mechanism: models anchor on nameplate capacity plans and assume supply chains scale like conventional EPC markets.
Direction: nuclear-grade capacity scales stepwise because codes, traceability, qualification, and regulator confidence gate throughput.
Where it shows up: long-lead packages (forgings, high-integrity welds, I&C, safety-class pumps and valves) and specialist civil works become the pacing items, and any slip amplifies financing cost and political risk.
Decision implication: forecast error is reduced when the baseline is built from executable procurement and vendor-readiness signals, not from announced reactor counts, and when schedule sensitivity is treated as a core underwriting variable.
Where do EU nuclear new-build projects fail in reality?
Mechanism: teams underestimate how nuclear QA/QC and regulator interaction reshape construction logic and contractor behavior.
Direction: productivity drops when documentation, hold points, and rework loops collide with immature design freeze and fragmented contracting.
Where it shows up: commissioning becomes the stress-test, with late design changes, supply non-conformances, and interface defects surfacing when rework is most expensive and politically visible.
Decision implication: bankability improves when the project shows disciplined design maturity, credible nuclear-qualified workforce plans, and a contracting structure that aligns EPC incentives with availability, documentation quality, and commissioning readiness rather than just mechanical completion.
How an IC team screens this market?
-
Underwrite schedule first: the value swing is IDC and covenant comfort, not headline capex optics.
-
Check long-lead package maturity: forging slots, safety-class components, and I&C qualification are gating.
-
Stress-test regulatory pathway: predictability of licensing interactions matters more than stated political backing.
-
Map contracting logic: fragmented scopes raise interface risk and rework probability at commissioning.
-
Validate workforce depth: nuclear-qualified trades and supervision are a real constraint, not a hiring plan.
-
Test counterparty resilience: utility balance sheet, state support structure, and offtake/power price framework.
-
Apply downside on grid and site interfaces: cooling, grid connection, and local permitting can become the silent critical path.
Market Dynamics
The demand pattern that matters is not general electricity demand, but system-level pressure for firm low-carbon capacity that can sit alongside renewables without importing volatility through gas exposure, and this pushes governments toward new-build decisions that look increasingly like industrial policy as much as energy policy. Where this shows up is in procurement localization targets, state-aid structures, and a preference for delivery models that retain national control over critical packages, because the political cost of delay is now as material as the financial cost.
Supply-side behavior is becoming more selective: nuclear-grade vendors ration capacity toward programs that offer serial visibility, disciplined change control, and clean contracting, while weaker projects pay through time rather than price because the penalty is often slot allocation and priority, not a simple cost premium. By 2030, the decisive transition is toward supply chains that behave like repeat manufacturing systems rather than one-off megaproject ecosystems, and investors are misreading risk when they treat each unit as isolated rather than as a program where learning curves and bottlenecks compound.
Policy movements are shaping economics through financing and risk-sharing rather than through rhetoric, with the EU’s own investment framing explicitly highlighting the scale and risk profile of nuclear investment needs.
Driver Impact Table
|
Driver |
Where it bites first |
Time window |
Who it impacts most |
Banded sensitivity (economics / DSCR / schedule) |
How we measure it in the pack |
|
State-backed risk sharing and financing structures reduce early-stage risk premia, and this shows up as more bankable drawdown conditions and lower schedule-related covenant anxiety |
Financing close and construction phase |
2025–2030 |
Banks, IC teams, utilities |
High DSCR sensitivity, High schedule sensitivity |
Deal-structure typology, covenant triggers, risk allocation map by archetype |
|
Vendor serial visibility improves slot allocation discipline, and this shows up as shorter qualification loops and fewer procurement resets |
Long-lead procurement |
2026–2030 |
OEMs, EPCs, operators |
High schedule sensitivity |
Long-lead package readiness scoring and vendor capacity allocation signals |
|
Regulatory predictability strengthens when design maturity is proven, and this shows up as fewer late-stage licensing surprises and smoother hold-point cadence |
Licensing and commissioning |
2026–2030 |
IC teams, operators |
Medium to High schedule sensitivity |
Regulator interaction cadence proxies, design freeze maturity indicators |
|
Workforce depth improves when programs commit to repeat builds, and this shows up as rising productivity and fewer QA-driven rework loops |
Site execution and QA |
2026–2030 |
Epcs, operators |
Medium opex and schedule sensitivity |
Workforce constraint index, nuclear-qualified trade availability proxies, rework drivers |
|
Supply-chain localization reduces political and logistics fragility, and this shows up as fewer cross-border compliance delays and better spare-part resilience |
Construction and early O&M |
2026–2030 |
Utilities, operators, OEMs |
Medium schedule sensitivity, Medium opex sensitivity |
Localization share bands (Dominant/Meaningful/Minor) by package category |
Drag Impact Table
|
Drag |
Where it bites first |
Time window |
Who it impacts most |
Banded sensitivity (economics / DSCR / schedule) |
How we measure it in the pack |
|
Long-lead nuclear-grade components remain capacity-constrained, and this shows up as slot rationing and procurement lead-time volatility rather than clean price signals |
Procurement critical path |
2025–2030 |
IC teams, EPCs, OEMs |
High schedule sensitivity |
Long-lead bottleneck map by component class, qualification queue indicators |
|
Design changes after early works begin increase QA hold points and rework, and this shows up as commissioning slippage and availability risk |
Commissioning and handover |
2026–2030 |
EPCs, operators, banks |
High DSCR and schedule sensitivity |
Design maturity gates, change-order stress test, commissioning readiness score |
|
Multi-party contracting fragments accountability, and this shows up as interface defects that surface late when fixes are slow and expensive |
Execution and commissioning |
2026–2030 |
Banks, IC teams, EPCs |
High schedule sensitivity |
Contracting archetype risk score, interface density index, LD and availability terms review |
|
Public acceptance and permitting challenges remain non-linear, and this shows up as local delays and legal exposure even when national policy is supportive |
Permitting and political risk |
2025–2030 |
Developers, utilities, banks |
Medium to High schedule sensitivity |
Permitting pathway maturity rubric and litigation exposure proxies |
|
Grid and site interface issues create hidden critical paths, and this shows up through cooling-water constraints, grid connection sequencing, and site enabling works delays |
Site readiness |
2025–2030 |
EPCs, operators |
Medium schedule sensitivity |
Site readiness checklist, enabling works maturity, interface risk flags |
Opportunity Zones and White Space
- Nuclear-grade qualification services and documentation throughput are becoming the shadow market, because QA regimes do not flex with political timetables and the bottleneck shows up as vendor onboarding delays and non-conformance cycles that elongate commissioning, which pushes IC teams to reward programs that can evidence traceability systems early.
- Standardized package design and repeat procurement is where value quietly accumulates, because serial ordering reduces requalification churn and this shows up as fewer procurement resets for safety-class components, which shifts bank comfort toward programs that treat supply chain as a repeatable system rather than a project-by-project scramble.
- Workforce and supervision depth as an investable constraint is emerging as a differentiator, because nuclear construction productivity is supervision-limited and this shows up in rework frequency and inspection backlog, which makes EPC delivery risk the decisive filter even when the reactor technology is credible.
- Interface-risk arbitrage in contracting is a real whitespace, because fragmented scopes create late-stage defects and this shows up at commissioning when fixes are slowest, which makes integrated delivery models and tighter change control disproportionately valuable for DSCR stability.
- Local supply chain build-out tied to specific long-lead packages remains underpriced, because localization narratives often chase headline percentages while the bottlenecks sit in a few specialized component categories, which shows up as “local content met” but schedule still slipping, and it changes what governments and utilities should actually sponsor.
Market Snapshot: By Reactor type, Project and Owner Type
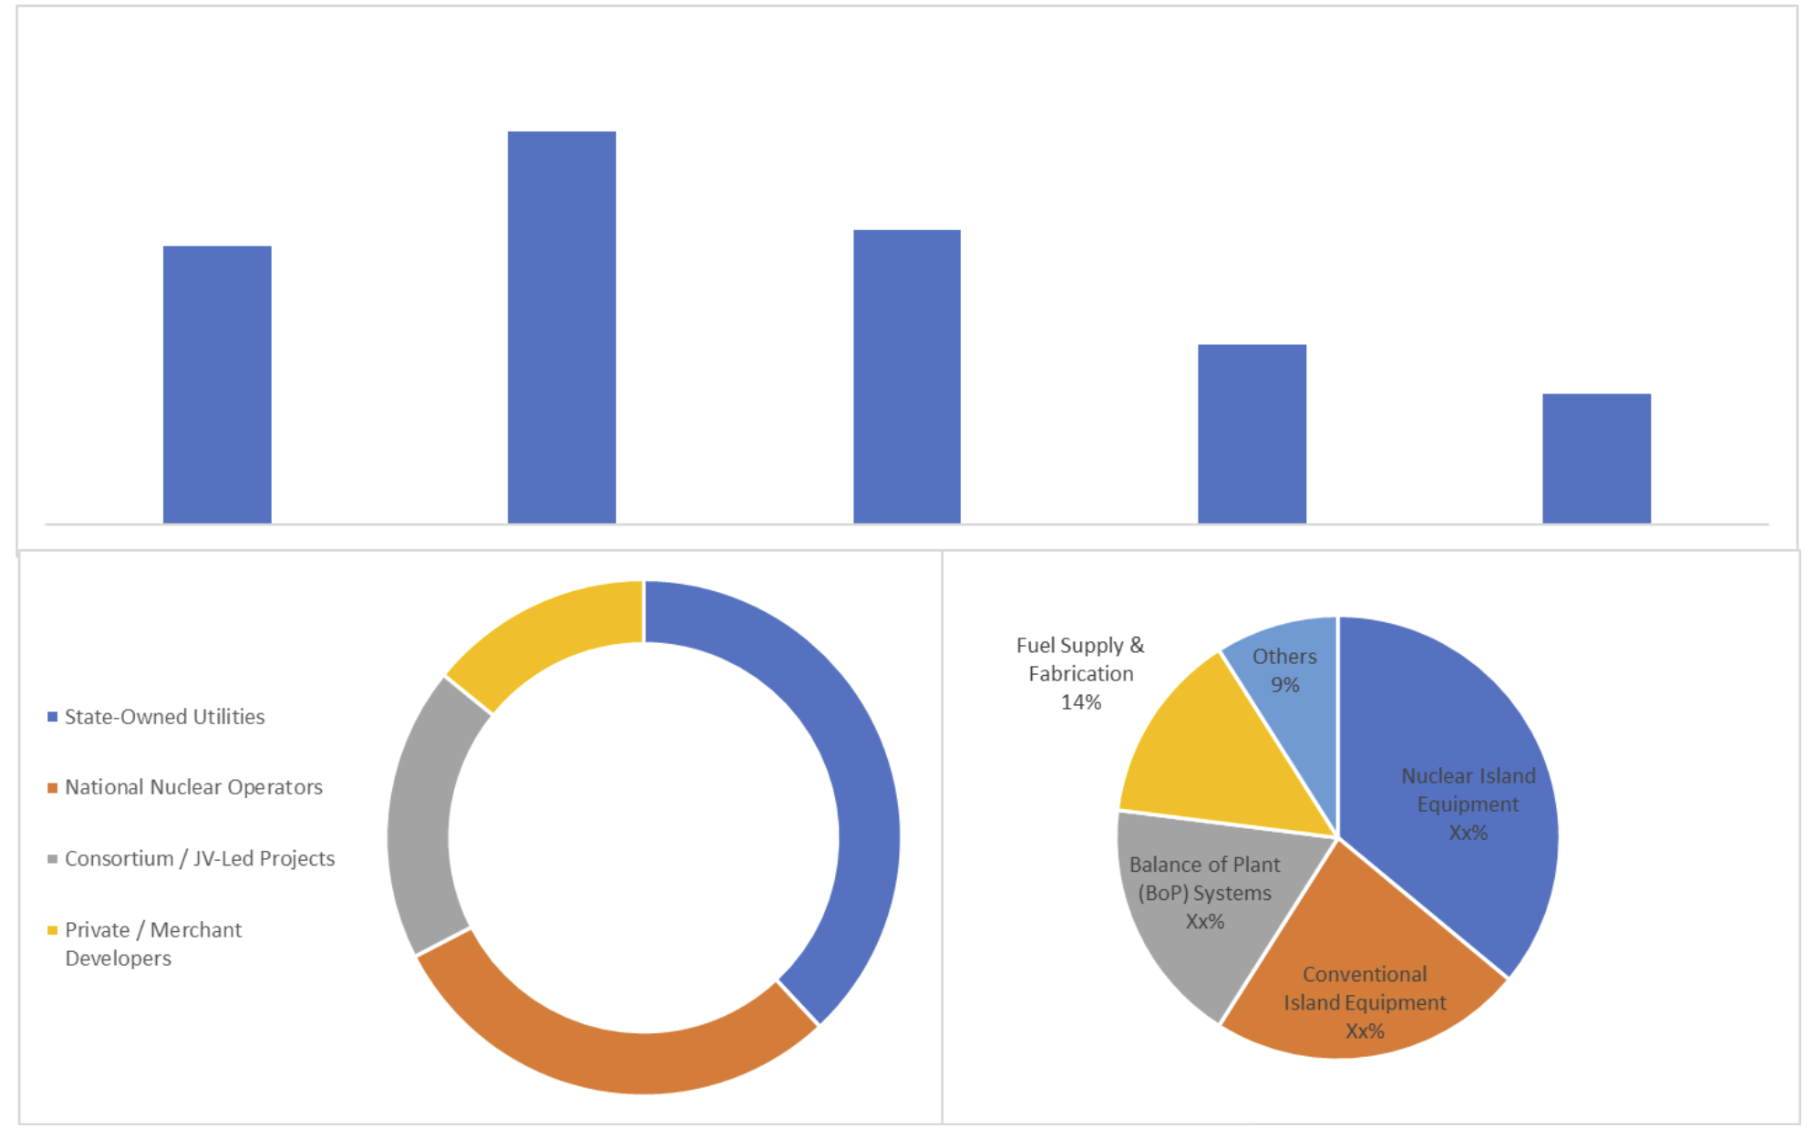
Source: Proprietary Research & Analysis
Mini Case Pattern
Pattern: From diligence to cashflow, where this market surprises teams
A utility-led large-reactor new-build program enters diligence with a strong political mandate and a financing plan that appears credible on paper, and the base case assumes that long-lead procurement behaves like premium industrial sourcing. Execution diverges when nuclear-grade documentation and qualification cycles become the pacing items, and early civil progress masks a growing backlog of approved vendor packages. The friction point is not a single vendor failure but a systems problem: design maturity lags procurement commitments, hold points multiply, and non-conformance handling stretches commissioning windows. For the IC, the surprise is that schedule becomes the main value driver through IDC and downside cases. For the bank, covenant comfort shifts toward proof of long-lead slot security and contracting discipline. For the operator, early O&M readiness and spare-part governance becomes part of construction risk.
Competitive Reality
Competitive advantage in this market is shifting away from “who can bid” toward “who can deliver without breaking nuclear QA culture under time pressure.” Share gains accrue to archetypes that can demonstrate nuclear-grade process discipline, stable subcontractor ecosystems, and a program view of repeatability, because that shows up in fewer late-stage surprises and in regulator confidence. Losers are not necessarily technically weak, but operationally inconsistent, where fragmented delivery and thin supervision create predictable rework and documentation debt.
Capital and talent follow credibility: programs that can show executable procurement plans and stable contracting terms attract stronger counterparties, while weaker programs become reliant on state support that still cannot buy time in qualification queues.
Strategy Pattern Table
|
Winning play |
Who uses it (archetype) |
Why it works |
Where it fails |
What signal to watch |
|
Serial procurement with design freeze discipline |
Repeat-build national programs |
Reduces qualification churn and procurement resets |
Fails when political timelines force early starts without design maturity |
Stability of long-lead package specs and change-order frequency |
|
Integrated delivery accountability |
Utility-led integrated EPC models |
Lowers interface defects that surface at commissioning |
Fails when scope is “integrated” in name but fragmented in subcontract reality |
Interface defect rates and commissioning readiness indicators |
|
Nuclear-qualified workforce flywheel |
Programs investing in training and supervision depth |
Productivity improves without compromising QA |
Fails when supervision is stretched and inspection backlogs grow |
Inspection backlog proxies and rework cycle time |
|
Vendor slot security as a financing input |
Projects aligned with vendor capacity planning |
Converts supply scarcity into predictable schedules |
Fails when slot “reservations” are not contractually hard |
Evidence of committed manufacturing slots and qualification status |
|
Contracting aligned to availability, not completion |
Operators and lenders pushing availability-linked outcomes |
Encourages commissioning quality and O&M readiness |
Fails if LDs are mis-set and drive defensive behaviors |
LD structure quality and commissioning milestone realism |
Key M and A Deals:
-
EDF acquires strategic stake in GE Vernova Steam Power nuclear business, it strengthens EDF’s turbine and lifecycle capabilities for new-build reactors and SMRs across Europe and enhances vertical integration in the supply chain.
-
Cyclife (EDF) acquires Balcke-Dürr Nuklear Service from Mutares, it expands Cyclife’s decommissioning engineering and nuclear services portfolio in Germany, supporting new-build waste management and supply-chain synergies.
-
Holtec and EDF UK entered into partnership for SMR-300 deployment (2025), this development targets up to £11 billion in UK SMR projects and combines Holtec’s technology with EDF’s EPC and supply-chain expertise.
-
Assystem divests 5% Framatome stake back to EDF (~USD 223M), it consolidates EDF’s control over nuclear engineering and supply-chain services for new-build programmes.
Key Private Equity Deals:
-
IRDI Capital Investissement / Bpifrance takes minority stake in Groupe D&S, the funds expansion of nuclear supply-chain components and engineering for French and European new-build projects.
-
Cherry Ventures and Balderton lead €130M round in Proxima Fusion, the largest EU fusion financing; supports stellarator technology development as a complementary supply-chain play for long-term nuclear innovation.
Key Developments:
-
The European Commission established the Alliance with 350+ members; the Strategic Action Plan was adopted in September 2025, identifying 10 concrete actions to accelerate SMR licensing, supply-chain localisation, and first deployments by the early 2030s.
-
Flamanville 3 enters commercial operation, France’s 1.6 GW EPR reactor started full commercial operation after 25 years of construction. Europe’s first new large reactor in decades, providing critical validation for the nuclear new-build supply chain.
-
Rolls-Royce SMR completes Step 1 Generic Design Assessment in UK, site preparation advanced at Trawsfynydd, marking the first European SMR design to enter formal regulatory review.
-
Romania and NuScale finalised terms for the first European VOYGR deployment, unlocking supply-chain contracts and setting a precedent for SMR new-build in Central Europe.
-
Belgium reversed its phase-out policy; similar life-extension and new-build discussions advanced in Italy, Czechia, and Poland, boosting demand for nuclear components and EPC services.
Capital And Policy Signals
The market signal from policy is increasingly expressed through financing architecture rather than slogans, and the EU’s updated investment framing puts nuclear in the category of high-capital, high-risk assets that require risk-mitigating instruments to mobilize investment at scale. In the UK, the government’s June 2025 commitment of over £14 billion to Sizewell C is a concrete example of policy translating into balance-sheet-backed delivery intent rather than mere ambition.
Funding patterns often contradict public narratives: investors talk about capex, but credit committees react first to schedule credibility, contracting clarity, and whether state support is structured to survive delays. Programs that can show repeatability and procurement maturity are treated as industrial systems, while “one-off megaproject” structures are discounted, even when the underlying need for firm low-carbon generation is accepted.
Decision Boxes
1. IC/Investor Decision Box: Underwriting thresholds that actually move IC memos
When long-lead packages and QA throughput are secured early, schedule uncertainty compresses and this shows up as tighter downside cases on IDC and fewer contingencies needed to protect returns, which changes the investment view from capex anxiety to delivery confidence and supports larger ticket sizing.
2. Bank Decision Box: What changes DSCR and covenant comfort first
When contracting reduces interface risk and commissioning readiness is evidenced, the probability of late-stage slippage falls and this shows up as improved covenant headroom and fewer drawdown conditions tied to milestone proof, which increases bank willingness to hold the risk through construction.
3. OEM Decision Box: Where specs, retrofits, and compliance budgets really shift
When regulator expectations harden around traceability and documentation completeness, compliance effort shifts upstream and this shows up as higher cost of vendor qualification and more stringent acceptance testing, which forces OEMs to prioritize repeatable documentation systems over marginal hardware optimization.
4. EPC Decision Box: Where delivery risk hides (scope, LDs, commissioning, availability)
When design maturity lags and scopes are fragmented, interface defects surface at commissioning and this shows up as rework under hold points and LD disputes, which pushes EPCs toward tighter change control and availability-linked incentives rather than aggressive construction-only schedules.
5. Operator Decision Box: What breaks in O&M and how it hits availability and opex
When spare-part governance and maintenance readiness are treated as post-handover problems, early-life availability suffers and this shows up as extended outages driven by qualification delays and documentation gaps, which increases opex volatility and feeds back into lender comfort on performance.
Methodology Summary
This pack builds its 2026–2030 outlook from executable delivery mechanics rather than headline reactor announcements. Forecast logic starts with market boundaries and program archetypes, then layers a pipeline reality check based on licensing maturity, procurement readiness, and contracting structure, because these are the variables that translate intent into construction progress. Supply-chain capacity is treated as a gating function, where vendor qualification throughput and long-lead manufacturing slots constrain achievable schedules, and schedule is then stress-tested into financing outcomes through banded DSCR sensitivity and covenant comfort logic.
Public sources, regulatory disclosures, project documentation, and EU-level investment framing are used to anchor the policy and financing environment, with explicit limitation notes where transparency ends. Risk adjustments are applied by shifting weight from nominal capex bands toward schedule and commissioning risk bands when procurement maturity and QA capacity are weak, because this is where real-world forecast error concentrates.
Analyst credibility box
The work is built like an IC memo: define boundaries, validate delivery mechanisms, and stress-test assumptions into financing outcomes. The hardest data to verify is supply-chain readiness below tier-1, especially qualification status and true capacity allocation for long-lead packages, so the pack uses proxy signals and confidence grading rather than false precision.
Limitations box
- Vendor capacity allocation is partly opaque, so readiness is expressed in bands and confidence levels.
- Project timelines can shift for political reasons, so the pack separates policy intent from executable milestones.
- Regulatory interactions vary by country, so risk is scored by pathway maturity rather than by ideology.
- Cost data is inconsistent across disclosures, so sensitivity is framed through schedule and DSCR bands.
What changed since last update
- EU investment framing for nuclear was refreshed with explicit investment-need signaling.
- New-build financing intent became more visible through state-backed moves in key markets.
- Several programs increased emphasis on localization and supply-chain readiness as a gating theme.
Source Map
- European Commission nuclear investment needs and PINC materials
- State-aid and policy decisions on nuclear financing and eligibility
- Project-owner disclosures for major new-build programmes (UK and EU markets)
- National nuclear regulators and licensing pathway publications (country-level)
- Grid operators for connection interfaces where relevant (TSO/DSO, site enabling)
- Procurement and tender disclosures for safety-class packages
- Workforce and skills pipeline disclosures (training, qualification regimes)
- Independent nuclear status reporting for schedule and delivery lessons
- IAEA programme and readiness materials for newcomer countries
- Sector press and disclosures on localisation and supplier mobilisation
Why This Reality Pack Exists
Generic nuclear market reports tend to treat new-build as a linear function of policy support and capex, then backfill a forecast. That is not where decision error comes from. In this market, error comes from mispricing delivery: long-lead packages, nuclear QA throughput, workforce depth, contracting structure, and commissioning readiness. This reality pack exists to correct that blind spot with an underwriting-first view that connects supply-chain constraints and execution friction directly to schedule, covenant comfort, and investability, without pretending that point forecasts are knowable in a market defined by gated capacity.
What You Get
- 80–100 slide PDF designed as IC-ready pages (screen able in committees, reusable in lender packs)
- Excel Data Pack
- 20-minute analyst Q&A focused on underwriting variables, not general market education
- 12-month major-policy mini-update covering material shifts in financing structures, regulatory posture, and pipeline credibility
Snapshot: EU Nuclear New-Build and Supply-Chain Market 2025–2030
Installed base is not the story here; the investable question is how many programs convert into repeatable delivery systems, because that conversion tightens vendor allocation and workforce productivity in ways that reduce schedule volatility. Growth over 2026–2030 is constrained less by intent than by nuclear-grade throughput, and this shows up as long-lead package rationing and qualification backlogs that move financing risk bands before they move headline budgets. Policy levers increasingly operate through risk-sharing and state support structures, which shows up as bankability improving in a subset of programs while others remain “announced” without procurement credibility. Operationally, the next five years matter because supply-chain investments made now determine whether commissioning risk becomes manageable by the early 2030s, and that directly shapes what IC teams can underwrite today.
Sample: What the IC-Ready Slides Look Like
-
One-page IC decision summary that separates policy intent from executable delivery signals
-
Consensus versus reality slide that contrasts announced pipeline against procurement maturity bands
-
Risk and mitigants layout linking long-lead packages, QA throughput, and commissioning readiness to schedule and DSCR sensitivity
-
Opportunity map showing where qualification services, workforce depth, and contracting models create investable edges
-
Deal-screen criteria page that ranks programs by licensing maturity, contracting structure, and vendor slot security
-
Sensitivity table using indexed baselines (2024=100) for schedule extension impacts on financing comfort bands
-
Pipeline heat snippet that highlights where localization affects gating packages rather than headline percentages
Why Purchase This Report?
IC-Defensible Thesis, Not “Market Size”
A decision frame you can take into committee: boundary, base case, and what would change our view.
Evidence Ladder You Can Audit
Artefacts-led (grid offers, tenders, term-sheet structures, warranty language), mapped to what each proves and where it fails.
IRR Kill-Shots and Early Signals
The repeatable ways projects miss IRR (timeline, capex, availability, settlement): plus the first signals that show up before the slide.
Regime Classes and Dominant Variables
Why identical assets underperform in different environments: the one variable that dominates returns by regime (payer, settlement, constraints, curtailment logic.
Table of Contents
EU Nuclear New-Build & Supply-Chain Market 2026–2030
1. Executive Brief/Summary (What Everyone’s Missing)
1.1 Market Size & Forecast (2026–2030)
1.2 Where Most Forecasts Go Wrong and Where the Money’s Actually Going
1.3 High-Level Opportunity Snapshot
2. Research Architecture & Field Intelligence
2.1 Research Methodology & Data Sources
2.2 Top 3 Growth Signals from Market Stakeholders
2.3 Execution Friction: Where Projects Fail in Reality
3. Demand Outlook
3.1 Key demand drivers, focused on what changes decisions
3.2 Underserved Buyer Segments & Use Cases
3.3 Procurement and Pricing Patterns
4. Opportunity and White Space Map
4.1 Two Priority Segments to Watch
4.2.Regions / verticals with high pain, low competition
4.3. Integration Gaps and Pricing Bands that still work
4.4. Top Risks & Practical de-risk Levers
5 Competitive Intelligence: Strategic Benchmarking
5.1 Market Share Breakdown: Key Players (2024/25E)
5.2 Who’s Gaining Share, and Why (Talent, M&A, Policy Edge)
5.3 Challenger Playbook: How Smaller Players Are Quietly Winning
5.4. Company Profiles
5.4.1. Company 1
5.4.2. Company 2
5.4.3. Company 3
5.4.4. Company 4
5.4.5. Company 5
5.5. Capital flows:
5.5.1. By Investor Type (VC, PE, Infra, Strategics)
5.5.2. Investment Patterns, M&A, JV, and Expansion Moves
6. Market Segmentation
6.1 By Reactor Technology Type
6.1.1 Large Generation III/III+ Reactors
6.1.2 Small Modular Reactors (SMRs)
6.1.3 Advanced / Gen IV Demonstration Reactors
6.1.4 Research & Test Reactors
6.1.5 Others
6.2 By Project Scope (Supply-Chain Focus)
6.2.1 Nuclear Island Equipment
6.2.2 Conventional Island Equipment
6.2.3 Balance of Plant (BoP) Systems
6.2.4 Fuel Supply & Fabrication
6.2.5 Others
6.3 By Build Status
6.3.1 New Greenfield Projects
6.3.2 Restarted / Revived Projects
6.3.3 First-of-a-Kind (FOAK) Builds
6.3.4 Fleet / Repeat Builds
6.3.5 Others
6.4 By Buyer / Project Owner Type
6.4.1 State-Owned Utilities
6.4.2 National Nuclear Operators
6.4.3 Consortium / JV-Led Projects
6.4.4 Private / Merchant Developers
6.4.5 Others
6.5 By Geography
6.5.1 France
6.5.2 United Kingdom
6.5.3 Poland
6.5.4 Czech Republic
6.5.5. Germany
6.5.6 Rest of Europe
7. Action Frameworks for 2025–2028
7.1 Market Entry Options by Archetype (Builders, Tech Entrants, Investors)
7.2 Three realistic GTM Patterns
7.3 Strategic Watchlist: What to Monitor Quarterly
8. IC-Ready Decision Pack (Slides You Can Reuse Directly)
8.1. One-page IC Summary (yes/no, where, how)
8.2. 4-5 IC slides you can re-use (market thesis, risk & mitigants, competition)
8.2. Cheat sheets
8.4 Country / Segment Prioritization Slide
8.5 “Go / No-Go” Checklist for 2025–2028
Appendix: Reference Frameworks & Background:
- A1. Regulatory overview (high-level, with links to primary docs)
- A2. PESTLE snapshot
- A3. Porters (one slide max, if at all)
- A4. Supply chain maps
- A5. Price band tables
Research Methodology
No research methodology information available for this report.
Frequently Asked Questions
Research Grounded in Verifiable Inputs
Our research draws on publicly verifiable inputs including regulatory filings, grid operator data, project announcements, and policy documents across Europe.
These inputs are cross-checked through structured discussions with industry participants to validate what is progressing in practice versus what remains theoretical.
Analyst-Led Research Support
Each report is supported by analysts who focus on specific energy domains and regions. Clients can discuss assumptions, clarify findings, and explore implications with analysts who follow these markets on an ongoing basis
Energy Insights,
Straight to Your Inbox
For People Who Sign Off on Energy Decisions.
Short updates on EU power, grids, storage, and execution risk. No spam, just what matters.
Unsubscribe anytime. No spam, ever.