EU Offshore Wind Grid Connection Services Market 2026–2030: Queue-to-Cashflow Risk, Export-Cable Delivery Friction, and Where Bankable Grid Works
Report Description
The EU Offshore Wind Grid Connection Services Market 2026–2030 is no longer a clean “build the windfarm, then connect it” story. Grid connection services are becoming the project’s pacing item because onshore reinforcement, permitting for landing points, and constrained marine installation windows are converging in the same years that auction volumes and repowering decisions are rising. The direction is clear in delivery behavior: connection packages are being re-cut into narrower scopes, risk is being pushed into interfaces, and schedule protection is being bought through earlier reservations, stronger LD structures, and tighter commissioning definitions. The decision implication is that underwriting based on turbine timelines and headline auction prices misses the biggest variance driver: time to first export and the probability that export capacity is “usable” when the project hits mechanical completion.
Mainstream forecasts often assume connection delivery is a utility back-office function that scales linearly with awarded capacity. In reality, capital is moving toward teams that can manage interdependence between TSO standards, OEM lead times, cable route constraints, and substation commissioning sequencing. Execution friction sits where responsibilities blur: grid-code compliance testing, protection and control integration, energization prerequisites, and late changes triggered by reinforcement delays. This is why the most informative signals are not generic pipeline MW, but queue position quality, connection agreement terms, landfall permitting status, and whether the connection design is standardized or bespoke in that country’s regime.
If you only change one assumption in your model, change: treat connection readiness as a bankability variable, not a schedule footnote, because the queue-to-cashflow gap is where DSCR gets silently repriced.
Key Insights
- 1When connection scope is modularized, interface count rises and the probability of acceptance friction increases, which shows up in commissioning delays and forces IC teams to underwrite time-to-export as a valuation variable.
- 2Where TSOs standardize connection offers and acceptance criteria, schedule variance compresses and lender comfort improves, which shows up in tighter completion definitions and lower downside tail risk in DSCR cases.
- 3Landfall and corridor permitting constraints create redesign risk rather than simple delay, which shows up as late route changes and scope shifts, and it should be treated as a binary diligence gate.
- 4Protection and control integration quality is becoming a critical-path determinant, which shows up in energization prerequisites and retesting cycles, and it changes how EPC scope and LD triggers should be structured.
- 5Grid-code evolution increases compliance workload and retrofits, which shows up in commissioning complexity and early-life operating constraints, and it shifts OEM value toward integration and services.
- 6Cable manufacturing slots and marine windows behave non-linearly under congestion, which shows up in schedule convexity when stress hits, and it makes procurement strategy a finance variable.
- 7Queue reforms can turn “paper position” into fragile priority, which shows up in conditional connection agreements and reprioritization risk, and it should be reflected in underwriting probability bands.
- 8Bankability is increasingly determined by export readiness definitions, which shows up in covenant focus and completion criteria, and it forces sponsors to align contracting language with lender logic.
Scope of the Study:
Above-the-fold Snapshot:
-
Grid connection has become the binding constraint more often than turbine supply, so projects that look “consented” can still carry hidden time-to-revenue risk when onshore reinforcement and offshore works are not synchronized.
-
The market is splitting between “utility-like, standardized connection scope” and “bespoke, friction-heavy delivery”, and this split shows up directly in contracting terms, interface risk, and lender comfort.
-
Bankability is increasingly a function of interface clarity across TSO, DSO, HVDC/HVAC OEMs, and marine EPC scope, not simply the headline auction terms.
Why do forecasts go wrong in the EU Offshore Wind Grid Connection Services Market?
Mechanism: forecasts treat grid connection as a standardized, utility-delivered milestone, so they underweight interface risk across TSO works, OEM delivery, marine installation, and grid-code compliance testing. Direction: the variance is shifting from “how fast turbines install” to “how reliably export capacity energizes and stays compliant.” Where it shows up: commissioning dates slip without headline construction failure, energization prerequisites change late, and acceptance tests elongate when onshore reinforcement or protection and control integration is not ready. Decision implication: IC teams should shift sensitivity from capex-only to time-to-export and acceptance probability, and lenders should stress DSCR headroom against grid-readiness scenarios, not just weather delays.
Where do offshore wind projects fail in reality on grid connection and execution friction?
Mechanism: failure is usually a sequencing and responsibility problem, not a single technical defect, because multiple parties own adjacent slices of the export system with different incentives. Direction: as connection packages become more modular, the number of interfaces grows, raising the chance that a “small” integration issue becomes a critical-path event. Where it shows up: late design changes at landfall or onshore substation, protection settings and SCADA integration mismatches, cable termination quality issues, and grid-code compliance retesting after system parameter updates. Decision implication: operators and EPCs should price interface management as a deliverable, IC teams should diligence acceptance criteria and test plans early, and banks should covenant around completion definitions that reflect export readiness, not mechanical completion.
How an IC team screens this market
-
Underwrite revenue certainty around first export and stable compliance, not only auction strike and turbine COD.
-
Stress permitting and landfall constraints as binary risks, because late route changes reprice schedule and scope.
-
Check grid connection agreement quality, queue position credibility, and energization prerequisites for hidden conditions.
-
Map interface count across TSO, OEM, EPC, and operator, because each interface is a schedule and LD trigger.
-
Test capex sensitivity in export cables and substations, but weight schedule risk higher where marine windows are tight.
-
Validate counterparty strength and contracting form for connection works, because risk transfer often fails in claims.
-
Treat policy durability as “delivery reality”, especially where TSO buildout lags auction cadence.
Market Dynamics
In the EU-27 + UK, grid connection services are being shaped by two competing forces: governments need auction volumes to clear, while TSOs and DSOs are managing physical constraints and social acceptance for new corridors. That tension is pushing a shift toward more standardized connection designs in some markets, because standardization reduces engineering churn and procurement volatility, and it shows up as clearer technical requirements and repeatable substation architectures. In markets where reinforcement is politically constrained, the direction is toward heavier queue management and conditionality, which surfaces in connection agreements, phased export capacity, and elongated commissioning requirements. The decision implication is that “market attractiveness” is no longer just seabed conditions and auction terms; it is the integrity of the grid delivery regime.
On the supply side, the behavior is also changing. OEMs for HVDC and high-voltage equipment, cable suppliers, and marine EPC aggregators are prioritizing backlog quality, which means sponsors are increasingly competing on risk profile and interface clarity, not only price. This shows up in tighter technical compliance language, greater insistence on defined grid-code testing responsibilities, and more conservative commissioning schedules. By 2030, the transition that matters is not a new turbine class for this market page, but the maturation of HVDC export architectures, offshore substations, and grid-forming controls expectations, because they change both acceptance testing burden and operational stability once energized. Investors tend to underestimate how quickly these technical expectations can shift, and overestimate how easily they can be retrofitted without schedule impact.
Driver Impact Table
|
Driver |
Directional impact on economics |
Where it is most relevant (EU-27 + UK) |
2026–2030 timing |
Buyer/operator most impacted |
How we measure it in the pack |
|
Standardized TSO connection frameworks and repeatable designs reduce rework and interface disputes |
Medium to High DSCR sensitivity via higher schedule certainty and fewer acceptance surprises |
North Sea core markets with mature TSO regimes |
Front-loaded, then stabilizes |
IC teams, banks, EPCs |
Connection agreement structure, standard scope mapping, acceptance criteria tightness index (2024=100) |
|
Earlier reservation and tighter sequencing of onshore reinforcement alongside offshore build |
High impact on time-to-export and cashflow timing |
Markets with constrained landing points and corridor buildouts |
Critical in mid-period |
IC teams, operators |
Queue quality scoring, reinforcement dependency mapping, months-of-critical-path exposure bands |
|
Improved grid-code clarity on offshore compliance testing reduces retest cycles |
Medium impact on schedule variance and commissioning cost risk |
Systems with frequent grid-code updates historically |
Continuous |
Operators, EPCs, OEMs |
Grid-code change frequency bands, compliance test plan complexity rank, retesting risk band |
|
Contracting evolution that prices and allocates interface management explicitly |
Medium to High impact via reduced claim cycles and clearer LD triggers |
Cross-border supply chains, multi-party packages |
Accelerating |
EPCs, banks |
Interface count per project archetype, LD trigger alignment score, claims risk proxy rank |
|
Higher availability of skilled commissioning and protection-and-control integration capacity |
Medium impact via fewer late integration failures |
Markets with heavy concurrent build years |
Mid to late period |
Operators, OEMs, EPCs |
Workforce tightness indicators, commissioning bottleneck rank, integration defect rate proxy bands |
Drag Impact Table
|
Drag |
Directional impact on economics |
Where it is most relevant (EU-27 + UK) |
2026–2030 timing |
Buyer/operator most impacted |
How we measure it in the pack |
|
Landfall and onshore corridor permitting friction forces route changes and late scope shifts |
High DSCR sensitivity via schedule slip and redesign costs |
Densely populated coasts and contested corridors |
Persistent |
IC teams, banks, EPCs |
Permit maturity ladder, route-change probability bands, schedule variance attribution mapping |
|
Cable manufacturing and marine installation window constraints create non-linear delays |
Medium to High impact on time-to-export |
North Sea and Baltic with weather-window compression |
Mid-period peak |
EPCs, operators |
Installation window risk bands, cable slot availability rank, critical-path exposure bands |
|
Protection and control integration mismatches extend energization and acceptance |
High impact on commissioning variance |
Projects with modularized scopes and multiple vendors |
Continuous |
Operators, OEMs |
Interface integration risk index, acceptance test elongation bands, responsibility clarity score |
|
HVDC/HVAC equipment lead-time volatility and change-order dynamics |
Medium impact on capex bands and schedule |
Projects with bespoke designs or late specification changes |
Early to mid period |
IC teams, OEMs |
Lead-time bands, change-order likelihood rank, procurement risk scoring |
|
Queue reforms and policy-driven re-prioritization create “paper position” risk |
Medium impact via loss of expected priority |
Markets actively reforming connection queues |
Event-driven |
Investors, developers |
Queue rule-change tracker, connection agreement conditionality scoring, priority durability rank |
Opportunity Zones & White Space
-
Interface-owned value creation, not just construction. The most defensible edge is emerging in sponsors and EPCs that treat interface management as an engineered product, because the market is moving toward modular scopes and that direction increases failure probability at handover points, most visibly in protection and control integration and acceptance testing. The decision implication is that diligence should price the interface plan and commissioning governance like a revenue-risk mitigant, not like project management overhead.
-
Geographies where grid regimes are maturing faster than auction narratives. Some pockets are becoming investable not because wind resource suddenly improves, but because TSOs have clarified standard connection offers and tightened energization prerequisites, which shows up as fewer discretionary conditions and more repeatable timelines. For IC teams, this shifts the “best market” lens toward rule clarity and reinforcement cadence, even when headline capex looks similar.
-
Export system retrofits and repowering-linked connection work. As older assets repower or extend life, connection upgrades, compliance retrofits, and substation modernization become material. The mechanism is grid-code tightening and asset age, the direction is higher retrofit demand, and it shows up in procurement of protection systems, transformers, and control upgrades. The decision implication is that service providers with outage planning and compliance expertise can win without chasing greenfield megaproject risk.
-
Bankability-led productization of connection packages. Where lenders tighten completion definitions around export readiness, the market rewards packages that simplify commissioning and reduce retest risk, showing up in preference for standard designs and clearer test plans. The decision implication is that OEM and EPC propositions should be written to lender language, not only to technical specs.
-
Cross-border supply chain and scheduling arbitrage. When marine windows and manufacturing slots become the binding constraint, teams that can pre-secure slots and sequence installation intelligently gain advantage, which shows up as less schedule convexity under stress. The decision implication is that procurement strategy becomes a finance variable, not merely an ops choice.
Market Snapshot: Service, Connection and Client Type
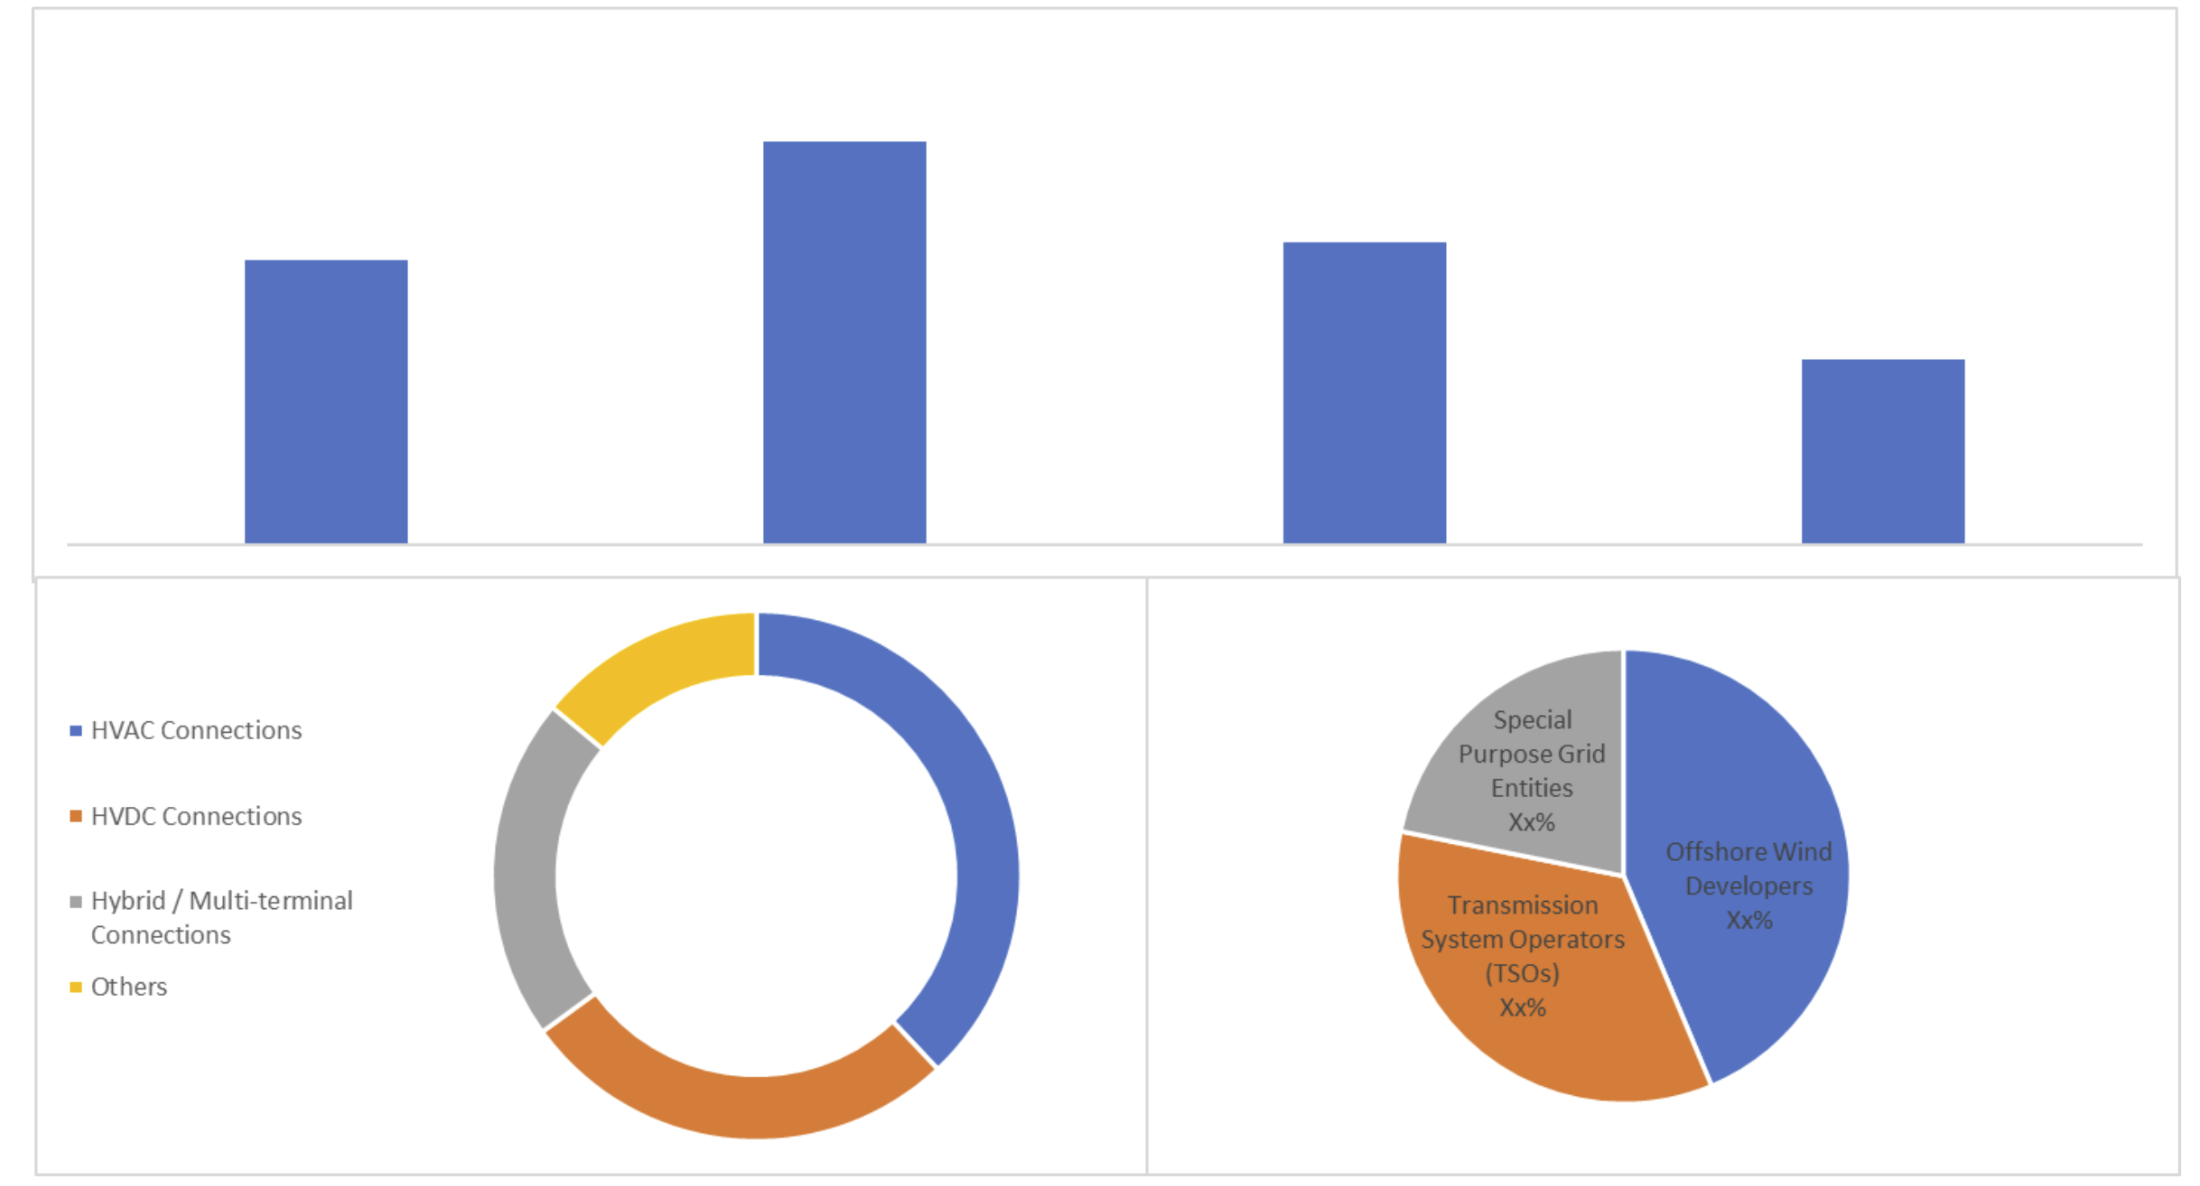
Source: Proprietary Research & Analysis
Mini Case Pattern
Pattern: From diligence to cashflow, where this market surprises teams
A sponsor underwrites a North Sea project with a standard-looking grid connection scope, expecting the export system to energize shortly after mechanical completion. Execution moves well offshore, but onshore reinforcement sequencing tightens and the project hits a late integration snag in protection and control settings during energization prerequisites, triggering additional compliance testing and retesting. The friction point is not an equipment failure, but responsibility ambiguity across TSO requirements, OEM settings, and EPC commissioning scope, which pushes time-to-export out of the “assumed” window and forces interim operating constraints.
IC implication: treat acceptance and energization criteria as a valuation driver with downside cases.
Bank implication: covenant around export readiness and test completion, not only mechanical completion.
Operator implication: invest early in commissioning governance and interface ownership to protect availability and opex.
Competitive Reality
Share is shifting toward players that can reduce uncertainty rather than those that quote the lowest unit cost. Utility incumbents with strong TSO relationships gain advantage when connection regimes reward standardization and predictable acceptance, because they can align designs and permissions earlier, and this shows up in smoother commissioning and fewer interface disputes. Conversely, challengers win where they bring a disciplined interface model and a proven commissioning playbook that reduces retesting and dispute cycles, especially in markets where modularization is increasing. The practical implication is that “best bidder” is increasingly the party that can make export readiness bankable, not the party that promises the fastest build.
Capital flow patterns reinforce this. Investors and banks are becoming more sensitive to completion definitions and schedule convexity, so EPC aggregators and OEM-aligned delivery models quietly benefit when they can offer clarity on scope boundaries and acceptance processes. The losers are teams that treat grid connection as a procurement line item and assume problems can be solved late, because late-stage fixes in protection systems, SCADA integration, and grid-code testing almost always sit on the critical path.
Strategy pattern table:
|
Winning play |
Who uses it (archetype) |
Why it works |
Where it fails |
What signal to watch |
|
Standardize connection design and acceptance playbooks |
Utility-aligned developer, repeat builder |
Reduces engineering churn and retest probability, improving schedule certainty |
Bespoke grid constraints or landfall changes force redesign |
Frequency of change orders and retesting events |
|
Own interface governance as a contracted deliverable |
EPC aggregator, commissioning-led integrator |
Interface clarity limits disputes and protects energization sequence |
If TSO prerequisites are conditional and move late |
Contract language on acceptance and responsibility boundaries |
|
Pre-secure manufacturing and marine windows early |
Scale sponsor, supply-chain disciplined IC |
Reduces schedule convexity under congestion |
Policy or queue changes invalidate assumed sequencing |
Slot reservation durability and cancellation terms |
|
Bankability-first completion definitions |
Sponsor with lender-led structuring |
Aligns stakeholders on “export readiness” rather than optics |
If operator handover is under-scoped |
Gap between mechanical completion and first export risk band |
|
Build compliance testing capability in-house |
Operator-led platform |
Faster fault isolation and fewer retest loops |
If OEM access is constrained or data is limited |
Grid-code update cadence and test plan complexity rank |
Recent M&A Deals:
-
Gulf Marine Services acquires mid-class offshore wind support vessel, GMS bought a specialised vessel to expand capacity for subsea cable laying, grid connection, and installation work on offshore wind farms.
-
James Fisher & Sons acquires specialised offshore wind O&M and grid support business, James Fisher expanded its marine services division with assets focused on cable installation and grid connection support services.
-
Briggs Marine & Environmental Services acquires O&M and grid connection assets, Briggs Marine acquired selected assets and personnel from a smaller operator to enhance its cable laying, ROV, and grid tie-in capabilities for offshore wind.
-
DEME Offshore completed a bolt-on acquisition of specialised cable-laying equipment and a small installation services firm to bolster its HVDC export cable and grid connection capabilities across the North Sea.
-
Van Oord acquired a niche ROV and subsea services company to enhance its offshore wind grid connection and cable burial operations, supporting larger turbine and floating wind projects.
Recent Private Deals:
-
EQT’s largest-ever infrastructure fund allocated capital to offshore wind transmission infrastructure, including HVDC cable-laying vessels, converter platforms, and grid connection services across the North Sea and Baltic regions.
-
CIP’s flagship fund dedicated significant commitments to offshore wind grid connection assets, including export cable systems, substation platforms, and tie-in projects in Denmark, UK, Germany, and the Netherlands.
-
Capital Dynamics secures additional commitments for clean energy infrastructure platform, the fund raised fresh capital specifically targeting offshore wind grid connection and marine services expansion, including HVDC-related installation capabilities in Mediterranean and North Sea markets.
-
AllianzGI and co-investors participated in structured equity or co-investment vehicles supporting TenneT’s large-scale HVDC grid connection projects for offshore wind farms.
Recent Developments:
-
ENTSO-E Offshore Roadmap, outlines hybrid interconnectors, offshore bidding zones (OBZs), and grid-forming tech for 300 GW integration; targets 2029 implementation for stability.
-
In 2026, North Sea Summit Germany, UK, 9 countries + EC agree on coordinated grid/offshore wind expansion, hybrid interconnectors by mid-2030s, and cross-border financing.
-
TEN-E Regulation revision, includes hybrid offshore grids/radial lines in PCI/PIP lists, accelerating permitting for connection infrastructure.
-
UK NESO connection regime reform clears 700 GW queue, unlocks £15B offshore investment with clearer timetables for grid services.
Capital & Policy Signals (Deal-Screen Useful)
Policy is increasingly signaling that offshore wind build targets must be reconciled with grid delivery reality, and the market is responding by shifting emphasis from “award volumes” to “deliverability”. Where policy supports anticipatory grid build and standard connection offers, revenue certainty improves because commissioning risk compresses and this shows up in stronger lender comfort and tighter completion definitions. Where policy keeps auction cadence high without clearing onshore constraints, the risk is mispriced as a generic schedule delay when it is often a compliance and interface risk that can hit DSCR more sharply.
On capital allocation, disciplined investors are prioritizing platforms with repeatable delivery and a track record of export readiness, even if headline returns appear similar, because schedule convexity under stress becomes the main differentiator in down cases. Funding patterns often contradict public narratives: a market can look “hot” on pipeline, yet be quietly rationed by banks when connection prerequisites and acceptance criteria are unclear.
Decision Boxes
IC/Investor Decision Box: Underwriting thresholds that actually move IC memos
Mechanism is export readiness uncertainty repricing time-to-cashflow, direction is wider downside tails in COD outcomes, it shows up as a gap between mechanical completion and first stable export. Decision implication is to stress IRR on acceptance probability and queue quality bands, not only capex bands.
Bank Decision Box: What changes DSCR and covenant comfort first
Mechanism is completion definition tightening around energization and compliance, direction is earlier covenant sensitivity to grid readiness, it shows up in lender focus on acceptance tests, protection and control integration, and TSO prerequisites. Decision implication is to set DSCR headroom scenarios tied to export readiness bands.
OEM Decision Box: Where specs, retrofits, and compliance budgets really shift
Mechanism is grid-code evolution increasing compliance and retrofit needs, direction is more scope in controls, protection, and integration than in basic hardware, it shows up in commissioning workload and retesting exposure. Decision implication is to price service and integration capacity as demand, not only equipment volume.
EPC Decision Box: Where delivery risk hides (scope, LDs, commissioning, availability)
Mechanism is interface proliferation turning minor issues into critical-path events, direction is higher claims and LD disputes unless scope boundaries are explicit, it shows up in handover criteria, test responsibilities, and energization prerequisites. Decision implication is to contract for interface ownership and acceptance governance.
Operator Decision Box: What breaks in O&M and how it hits availability and opex
Mechanism is poor commissioning closure creating latent faults, direction is higher early-life outages and troubleshooting burden, it shows up in protection settings, SCADA integration, and recurring compliance checks. Decision implication is to demand stronger commissioning documentation and data access to protect availability and opex bands.
Methodology Summary
This pack builds the 2026–2030 view by treating grid connection as a delivery system with measurable constraints, not as an assumed milestone. Forecast logic is scenario-based and anchored in three linked layers: expected auction and project pipeline translation into connection demand, TSO and DSO reinforcement and connection regime capacity, and supply-side delivery capability across HV equipment, export cables, marine installation, and commissioning. Assumptions are validated by triangulating public pipeline disclosures, grid plans, connection queue signals where available, regulatory documents on connection offers, and observed patterns in commissioning and acceptance outcomes, then applying risk adjustments that explicitly stress time-to-export and acceptance probability rather than only capex ranges.
Analyst credibility box:
We build market views from how projects reach export, not from headline capacity targets. The hardest data to verify in this market is what sits between “connection agreement signed” and “stable export achieved”, because acceptance prerequisites, integration responsibility, and retesting causes are often scattered across stakeholders.
Limitations box:
-
Queue position quality is not always transparent, so we use bands and regime-level indicators rather than point timings.
-
Grid-code changes can be sudden, so we model sensitivity through compliance workload and retesting risk bands.
-
Contract terms are often confidential, so we infer risk allocation patterns from public procurement structures and standard frameworks.
-
Supply chain timing varies by vendor and project design, so lead-time risk is expressed as ranked exposure by archetype.
What changed since last update:
-
Greater emphasis on acceptance and commissioning as the core variance driver, not only construction sequencing.
-
Stronger separation between standardized connection regimes and bespoke, interface-heavy delivery regimes.
-
Updated risk adjustment logic to stress export readiness probability in lender-relevant terms.
Source Map
-
ENTSO-E planning and network development publications
-
National TSOs’ offshore grid plans and connection framework documents
-
National regulators’ connection, charging, and grid-code publications
-
Auction result releases and allocation rule documents
-
Permitting and spatial planning registers for landfall and corridors
-
Grid connection queue disclosures where available, and regime rule updates
-
Public project pipelines from developers, utilities, and system operators
-
OEM disclosures on HVDC/HVAC equipment and export system delivery constraints
-
Marine installation and cable supply chain capacity signals in public disclosures
-
Financing and lender commentary on completion definitions and covenant focus
-
Technical standards and grid-code compliance documentation
-
Public commissioning and acceptance pattern disclosures from operators and authorities
Why This Reality Pack Exists
Generic syndicated reports often treat offshore grid connection as a checkbox: capacity targets go in, a smooth build curve comes out. That approach misses the real repricing mechanism in 2026–2030: time-to-export and acceptance probability are becoming the driver of DSCR comfort and valuation outcomes, and those are shaped by interfaces, grid-code compliance, and reinforcement constraints that do not behave linearly. This Reality Pack exists to correct the blind spot that matters most to decision teams, separating “paper progress” from export readiness, and mapping which regimes and delivery models reduce downside tails without pretending to provide false precision.
What You Get
-
80–100 slide PDF designed as IC-ready slides, written for investment committees, lenders, and strategy heads
-
Excel Data Pack
-
20-minute analyst Q&A focused on underwriting variables, risk bands, and diligence traps
-
12-month major-policy mini-update covering changes that alter connection regimes, grid-code expectations, queue rules, or bankability assumptions
Snapshot: EU Offshore Wind Grid Connection Services Market 2025–2030
Installed offshore wind continues to expand across EU-27 + UK, but grid connection readiness is becoming a gating factor because reinforcement buildout, landfall permitting, and commissioning capacity are tightening in the same build window. The direction is toward larger variance between “build complete” and “export ready”, which shows up in acceptance test elongation, conditional energization, and higher emphasis on protection and control integration quality, and the decision implication is that underwriting and contracting must pivot from capex certainty to export certainty. Policy levers increasingly aim to standardize connection offers and accelerate grid buildout, yet risk bands remain wide where corridor consent is contested and queue reforms introduce priority uncertainty, so the next five years matter mainly because they determine which regimes become repeatable and bankable versus chronically interface-fragile.
Sample: What the IC-Ready Slides Look Like
-
1-page IC decision summary that isolates export readiness risk bands and what moves DSCR comfort
-
Consensus vs reality chart that contrasts pipeline headlines with queue quality and acceptance probability proxies
-
Risk and mitigants layout that maps interface points across TSO, OEM, EPC, operator, with diligence questions tied to each
-
Opportunity map showing where standardized regimes compress downside tails versus where bespoke delivery expands them
-
Deal-screen criteria slide listing the underwriting variables that actually change go/no-go decisions
-
Sensitivity table using indices and bands for time-to-export exposure, acceptance retest risk, and capex band sensitivity
-
Pipeline heat snippet that focuses on commissioning bottlenecks, landfall constraints, and reinforcement dependencies rather than only awarded capacity
Why Purchase This Report?
IC-Defensible Thesis, Not “Market Size”
A decision frame you can take into committee: boundary, base case, and what would change our view.
Evidence Ladder You Can Audit
Artefacts-led (grid offers, tenders, term-sheet structures, warranty language), mapped to what each proves and where it fails.
IRR Kill-Shots and Early Signals
The repeatable ways projects miss IRR (timeline, capex, availability, settlement): plus the first signals that show up before the slide.
Regime Classes and Dominant Variables
Why identical assets underperform in different environments: the one variable that dominates returns by regime (payer, settlement, constraints, curtailment logic.
Table of Contents
EU Offshore Wind Grid Connection Services Market
1. Executive Brief/Summary (What Everyone’s Missing)
1.1 Market Size & Forecast (2025–2030)
1.2 Where Most Forecasts Go Wrong and Where the Money’s Actually Going
1.3 High-Level Opportunity Snapshot
2. Research Architecture & Field Intelligence
2.1 Research Methodology & Data Sources
2.2 Top 3 Growth Signals from Market Stakeholders
2.3 Execution Friction: Where Projects Fail in Reality
3. Demand Outlook
3.1 Key demand drivers, focused on what changes decisions
3.2 Underserved Buyer Segments & Use Cases
3.3 Procurement and Pricing Patterns
4. Opportunity and White Space Map
4.1 Two Priority Segments to Watch
4.2.Regions / verticals with high pain, low competition
4.3. Integration Gaps and Pricing Bands that still work
4.4. Top Risks & Practical de-risk Levers
5. Competitive Intelligence: Strategic Benchmarking
5.1 Market Share Breakdown: Key Players (2024/25E)
5.2 Who’s Gaining Share, and Why (Talent, M&A, Policy Edge)
5.3 Challenger Playbook: How Smaller Players Are Quietly Winning
5.4. Company Profiles
5.4.1. Company 1
5.4.2. Company 2
5.4.3. Company 3
5.4.4. Company 4
5.4.5. Company 5
5.5. Capital flows:
5.5.1. By Investor Type (VC, PE, Infra, Strategics)
5.5.2. Investment Patterns, M&A, JV, and Expansion Moves
6. Market Segmentation
6.1 By Service Scope
6.1.1 Offshore Substation Design & Installation
6.1.2 Export Cable Engineering, Procurement & Installation (EPCI)
6.1.3 Grid Integration, Testing & Commissioning
6.1.4 Decommissioning & Grid Disconnection Services
6.1.5 Others
6.2 By Connection Topology
6.2.1 HVAC Connections
6.2.2 HVDC Connections
6.2.3 Hybrid / Multi-terminal Connections
6.2.4 Others
6.3 By Project Phase Engagement
6.3.1 Front-End Engineering & Permitting Support
6.3.2 Construction & Installation Phase Services
6.3.3 Commissioning & Grid Handover
6.3.4 Others
6.4 By Client Type
6.4.1 Offshore Wind Developers
6.4.2 Transmission System Operators (TSOs)
6.4.3 Special Purpose Grid Entities
6.4.4 Others
6.5 By Geography
6.5.1 Germany
6.5.2 United Kingdom
6.5.3 Netherlands
6.5.4 Denmark
6.5.5 Rest of Europe
7. Action Frameworks for 2025–2028
7.1 Market Entry Options by Archetype (Builders, Tech Entrants, Investors)
7.2 Three realistic GTM Patterns
7.3 Strategic Watchlist: What to Monitor Quarterly
8. IC-Ready Decision Pack (Slides You Can Reuse Directly)
8.1. One-page IC Summary (yes/no, where, how)
8.2. 4-5 IC slides you can re-use (market thesis, risk & mitigants, competition)
8.2. Cheat sheets
8.4 Country / Segment Prioritization Slide
8.5 “Go / No-Go” Checklist for 2025–2028
Appendix: Reference Frameworks & Background:
-
A1. Regulatory overview (high-level, with links to primary docs)
-
A2. PESTLE snapshot
-
A3. Porters (one slide max, if at all)
-
A4. Supply chain maps
-
A5. Price band tables
Research Methodology
No research methodology information available for this report.
Frequently Asked Questions
Research Grounded in Verifiable Inputs
Our research draws on publicly verifiable inputs including regulatory filings, grid operator data, project announcements, and policy documents across Europe.
These inputs are cross-checked through structured discussions with industry participants to validate what is progressing in practice versus what remains theoretical.
Analyst-Led Research Support
Each report is supported by analysts who focus on specific energy domains and regions. Clients can discuss assumptions, clarify findings, and explore implications with analysts who follow these markets on an ongoing basis
Energy Insights,
Straight to Your Inbox
For People Who Sign Off on Energy Decisions.
Short updates on EU power, grids, storage, and execution risk. No spam, just what matters.
Unsubscribe anytime. No spam, ever.