Europe Nuclear & Thermal Asset Lifecycle Services 2026–2030: LTO Reality, Decommissioning Drag, and the Maintenance-to-Cashflow Gap That Moves DSCR
Report Description
EU Nuclear & Thermal Asset Lifecycle Services is moving into a regime where asset age, not new-build ambition, is the binding variable for dependable megawatts. Nuclear already contributes a material share of EU electricity and remains concentrated in a defined set of member states, which makes lifecycle workstreams unusually visible to regulators, system planners, and lenders. Meanwhile thermal fleets are being thinned by coal exits and reshaped by security-of-supply and district heat constraints, which pushes owners toward a harder question: whether lifecycle spend creates dispatchable value, or merely postpones closure risk.
Mainstream market narratives tend to miss how maintenance outcomes are being repriced into credit, not just opex, because the probability-weighted cost of forced outages, scope creep, and regulator-driven rework is increasingly what sets covenant comfort and capacity value. The practical friction sits in outage windows, component lead times, documentation acceptance, and contractor quality systems, where small deviations tu
into schedule cascades and availability penalties. Capital is moving toward operators and delivery models that can prove repeatable outage performance and traceability, not simply “having capability”, and the signals that matter show up in outage duration distribution, inspection findings closure rates, and procurement discipline around long-lead nuclear-grade components.
If you only change one assumption in your model, change: your DSCR downside case so it is driven first by outage slippage and regulator rework probability, not by average annual maintenance spend, because the maintenance-to-cashflow gap is where this market surprises underwriting.
Key Insights
- 1When regulator acceptance thresholds tighten and documentation throughput becomes the bottleneck, outage critical paths lengthen and availability variance rises, which shows up in weaker cashflow timing and lower covenant comfort, so underwriting should anchor to acceptance risk tiers rather than average spend.
- 2When long-lead nuclear-grade procurement constraints bind, cost savings stop mattering relative to schedule certainty, which shows up in higher value placed on qualification depth and supplier traceability, so OEM and EPC advantage increasingly comes from proof and delivery repeatability.
- 3When coal exit pathways are uneven across Europe, thermal end-of-life workstreams cluster in specific countries and sites, which shows up in volatile closure scope and stakeholder friction, so banks should stress-test closure liabilities with bands rather than assume linear wind-down.
- 4When flexibility needs keep some thermal assets system-relevant, forced outages become disproportionately expensive relative to maintenance cost, which shows up in retrofit prioritization and tighter LD sensitivity, so operators should invest in reliability actions with measurable availability impact.
- 5When multi-contractor interfaces expand during outages and retrofits, quality system failures multiply rework probability, which shows up in commissioning drag and dispute risk, so EPC governance and configuration control become bankability features, not operational preferences.
- 6When lifecycle decisions are filtered through taxonomy and reporting frameworks, evidence expectations can rise without a change in physics, which shows up in higher internal hurdles for acceptance-ready documentation, so teams should plan proof objects early to avoid late-cycle rework.
- 7When decommissioning governance is treated as an EU-level policy concern, end-of-life programs face scrutiny beyond local project logic, which shows up in higher emphasis on long-term protection and regulatory control removal steps, so closure readiness should be scoped as a compliance pathway.
- 8When nuclear remains a material contributor in the EU and output changes year to year, lifecycle performance becomes politically salient, which shows up in stronger focus on reliability and outage discipline, so service providers win by reducing variance rather than selling volume.
Scope of the Study
Above-the-Fold Snapshot
-
This is a cashflow protection market, not a “services spend” market: ageing-driven scope growth is real, but bankability hinges on outage execution and regulatory acceptance, not how many frameworks sit on a slide.
-
The center of gravity is shifting from routine maintenance to life-extension proof and end-of-life liability: LTO evidence packs and decommissioning readiness increasingly set the risk narrative regulators and lenders price.
-
Thermal lifecycle is fragmenting: coal exits and flexibility needs push owners toward selective life-extension, mothball discipline, or closure preparation, each pulling different service mixes and contract terms.
Why do forecasts go wrong in EU Nuclear & Thermal Asset Lifecycle Services Market?
Most forecasts treat lifecycle services as a stable spend line that scales with installed base, but the spend-to-outcome link is non-linear.
Mechanism: ageing findings, documentation thresholds, and nuclear-grade supply constraints convert “planned scope” into “regulator-accepted scope” only after iterative rework.
Direction: variance increases over time, so averages stop describing reality.
Where it shows up: outage windows slip, component substitutions fail qualification, and compliance evidence expands mid-cycle, shifting availability and penalty exposure. Decision implication: IC teams should model volatility and tail risk through availability and DSCR headroom bands, while operators should prioritize repeatable execution systems and supplier qualification depth over nominal service capacity.
Where do lifecycle programs fail in reality for nuclear and thermal assets?
Failures concentrate where execution meets proof.
Mechanism: scope is “discovered” late because inspections, NDT, and condition monitoring reveal defects that trigger engineering change, regulator engagement, and new procurement.
Direction: once a critical path item shifts, recovery is limited by outage windows, trained labor availability, and long-lead parts.
Where it shows up: turbine and generator repairs collide with grid needs, nuclear outages expand due to documentation gaps, and thermal closure prep underestimates residuals handling and site condition obligations.
Decision implication: banks should stress-test schedule and availability, OEMs and EPCs should price risk around quality gates and documentation acceptance, and operators should harden configuration control and supplier traceability.
How an IC team screens this market?
-
Tests whether lifecycle scope converts into regulator-accepted work without rework loops that expand outage duration.
-
Underwrites availability and penalty exposure as primary economics, with maintenance cost as secondary.
-
Validates long-lead component access and qualification pathways for nuclear-grade and high-stress thermal parts.
-
Checks counterparty strength of EPC and specialist contractors through delivery record, not marketing claims.
-
Maps permitting and compliance obligations for major modifications, life extension, and end-of-life activities.
-
Stress-tests DSCR sensitivity to outage slippage, commissioning drag, and documentation acceptance.
-
Looks for repeatability signals such as outage duration dispersion, repeat findings, and closure rates.
Market Dynamics
The nuclear side of this market is structurally shaped by the fact that EU nuclear generation is concentrated in specific countries and has recently shown year-on-year production movement, which increases political and regulatory attention on life extension and operational reliability rather than optional upgrades. As LTO becomes more central to maintaining firm capacity, the demand pattern shifts toward evidence-heavy programs such as ageing management, inspection regimes, safety case updates, and outage execution disciplines that minimize schedule variance. A practical consequence is that the most valuable service providers are those who can compress the loop from inspection finding to regulator-accepted resolution, because that loop is what governs outage critical path risk and therefore revenue certainty for owners and lenders.
Thermal lifecycle dynamics are bifurcating: coal exits create an end-of-life services pull, while remaining thermal and CHP assets face a “flexibility premium” that rewards availability but punishes unreliability. Coal closure announcements and timelines are uneven across Europe, so service demand clusters around closure preparation, environmental remediation readiness, and selective reliability upgrades where systems still need dispatchable support. Investors frequently overestimate how quickly a fleet can be rationalized without incurring unpriced site liabilities, and underestimate how quickly a single long-lead part or a contractor quality failure can translate into months of availability loss.
Policy and finance now interact more explicitly with lifecycle decisions. The EU taxonomy framework includes criteria for certain nuclear and gas activities, which influences what “bankable” looks like in reporting-heavy institutions, even when the underlying engineering is unchanged. For decision teams, the market is increasingly about whether lifecycle work can be translated into defensible, auditable proof objects that survive scrutiny from regulators, insurers, and credit committees.
Driver Impact Table
|
Driver statement |
Where it bites hardest (geography / asset type) |
Time window (2026–2030) |
Who is most impacted |
Economics sensitivity band |
How we measure it in the pack |
|
Ageing evidence requirements become the gating item for nuclear life extension decisions, so validated inspection and documentation throughput becomes a capacity retention lever |
Nuclear-operating member states and the UK; ageing fleets |
2026–2030 |
Operators, banks, regulators |
DSCR sensitivity: High |
Outage duration dispersion index (2024=100), finding closure rate bands, regulator rework frequency scoring |
|
Long-lead nuclear-grade parts and qualified labor pools tighten, shifting value from price-led contracting to assurance-led contracting |
Cross-border nuclear supply chains |
2026–2029 |
OEMs, EPCs, operators |
Availability sensitivity: High |
Lead-time bands by component class, supplier qualification depth score, labor availability risk tiers |
|
Coal exit schedules and site repurposing create a surge in end-of-life engineering, residuals handling, and remediation planning |
Coal-heavy countries; CHP-linked sites |
2026–2030 |
Owners, EPCs, banks |
Capex band sensitivity: Medium |
Closure readiness maturity model, residuals pathway mapping, remediation obligation classification |
|
Flexibility value for remaining thermal assets increases the penalty for forced outages, pushing reliability retrofits and predictive maintenance adoption |
Markets where thermal still provides balancing and heat |
2026–2030 |
Operators, TSOs/DSOs |
€/MWh capture sensitivity: Medium |
Forced outage risk rank-order, retrofit impact scoring, maintenance-to-availability linkage index |
Drag Impact Table
|
Drag statement |
Where it bites hardest (geography / asset type) |
Time window (2026–2030) |
Who is most impacted |
Economics sensitivity band |
How we measure it in the pack |
|
Regulator acceptance thresholds and evidence quality gaps trigger rework loops, so planned scope does not convert cleanly into accepted outcomes |
Nuclear lifecycle and major modifications |
2026–2030 |
Operators, banks, EPCs |
DSCR sensitivity: High |
Documentation acceptance risk tiers, rework probability bands, schedule slippage stress cases |
|
Outage window constraints collide with grid needs, limiting recovery options once critical path slips |
Nuclear and thermal where adequacy is tight |
2026–2030 |
TSOs, operators |
Months of delay sensitivity: Medium–High |
Outage window constraints mapping, adequacy pressure proxy, recovery option availability ranking |
|
Contractor quality systems and interface management failures expand LDs, commissioning drag, and availability underperformance |
Multi-contractor outages and retrofits |
2026–2030 |
EPCs, OEMs, operators |
Opex sensitivity: Medium |
Interface complexity score, LD exposure bands, commissioning drag index |
|
Thermal end-of-life liabilities are under-scoped, especially for residues, environmental restoration, and stakeholder constraints, creating closure cost volatility |
Coal sites and CHP-linked plants |
2026–2030 |
Owners, banks |
Capex band sensitivity: Medium–High |
Liability scope checklist, closure cost volatility bands, permitting and stakeholder friction score |
Opportunity Zones & White Space
-
“Proof-first” LTO support as an investable capability: the whitespace sits in converting inspection outputs into regulator-ready evidence packs at speed, because that reduces outage variance and moves covenant comfort more than incremental cost savings, particularly in nuclear-operating EU member states and the UK.
-
Outage execution platforms that shrink variance, not just duration: buyers overpay for nominal capacity and underpay for repeatability, so delivery models that standardize workpacks, qualification, and configuration control can win where owners are penalized on availability rather than spend.
-
Thermal closure preparation that is scoped like a project finance risk item: as coal exits proceed unevenly, there is whitespace in services that map residuals pathways, remediation obligations, and stakeholder constraints early enough to avoid closure cost shocks.
-
Hybrid nuclear-thermal service portfolios aimed at grid reliability: providers who can bridge nuclear outage disciplines with thermal flexibility reliability needs can capture portfolios where owners are optimizing system value across mixed fleets rather than bidding each asset in isolation.
-
Digital inspection and condition monitoring with auditability as the product: tools are common; defensible traceability is not. The investable gap is where data can be used in safety case and compliance evidence without creating new rework loops.
-
Bank-facing risk packaging: lifecycle programs that come with clear risk registers, measurable execution KPIs, and stress-tested availability cases tend to travel faster through committees than technically similar programs presented as engineering narratives.
Market Snapshot - By Asset type, Service and Contracting type
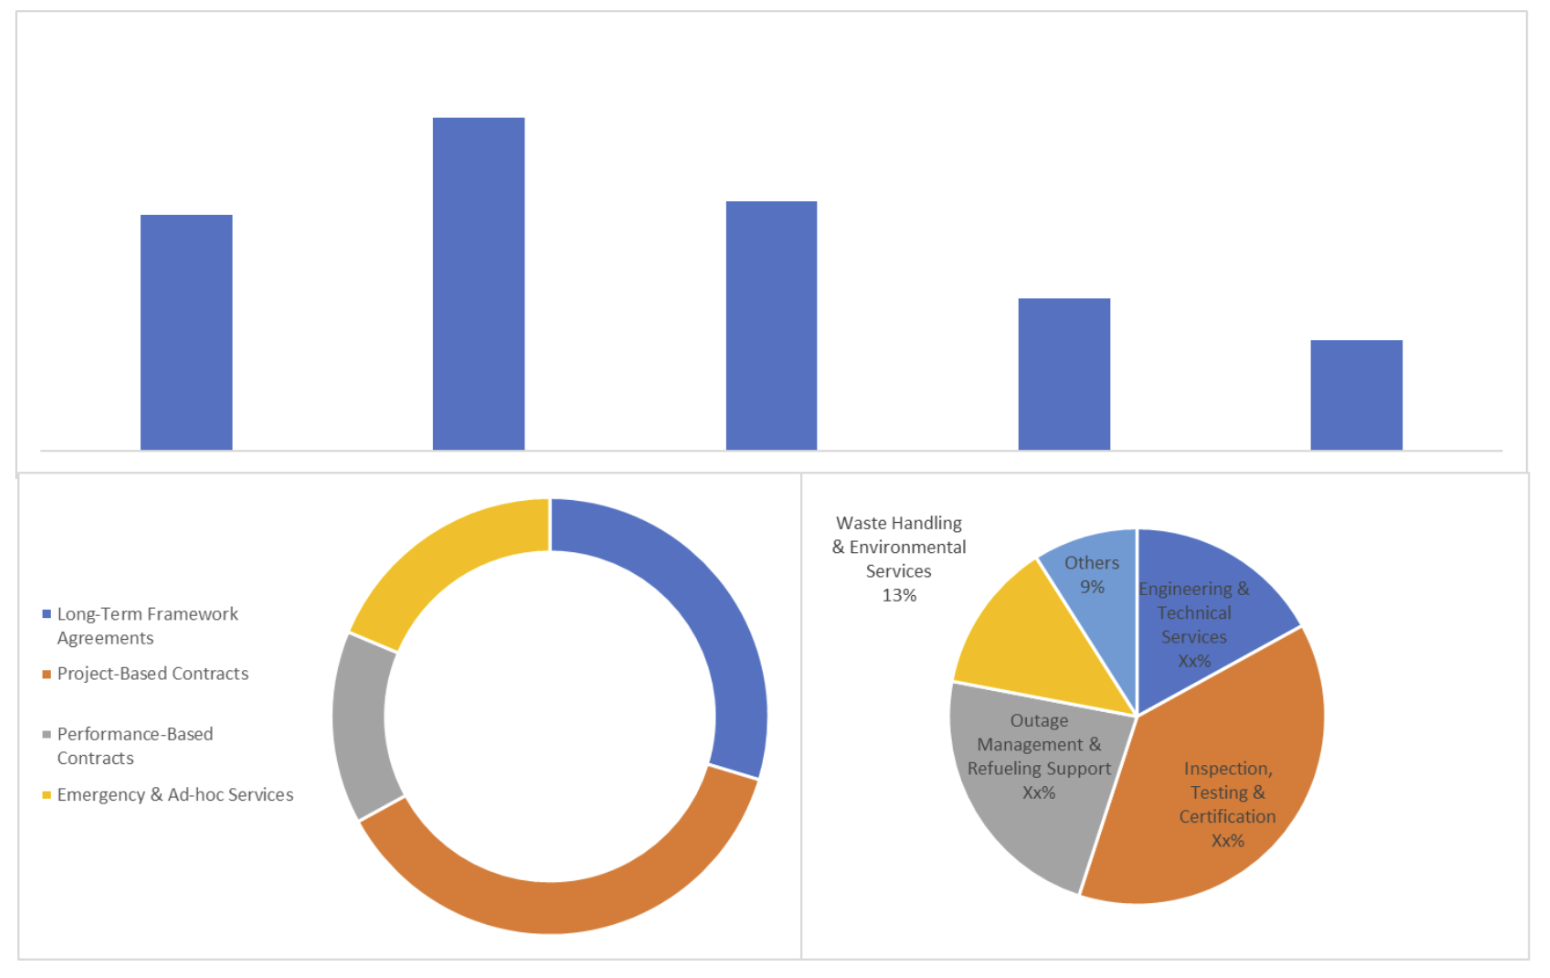
Source: Proprietary Research & Analysis
Mini Case Pattern
Pattern: From diligence to cashflow, where this market surprises teams
A portfolio owner underwrites a nuclear outage and life-extension workstream plus a thermal unit reliability retrofit as “manageable operational upgrades” with conservative contingency, assuming scope stability once pre-outage inspections are complete. During execution, inspection findings trigger engineering changes and documentation expansions that require additional qualification and regulator engagement, while a long-lead component constraint removes the option to resequence work without extending the outage window. The exact friction point is the proof chain, where evidence quality and acceptance timing, not workmanship alone, governs when the asset can return and what conditions attach.
IC implication: model DSCR downside primarily through outage variance and acceptance risk bands.
Bank implication: covenant comfort moves first with credible schedule and acceptance stress cases.
Operator implication: invest in configuration control, supplier traceability, and closure of findings before the outage window opens.
Competitive Reality
This is not a “many providers, price-clears” market; it is a delivery credibility market where winners compound learning through repeatable outages, qualified labor pipelines, and tight supplier qualification, while weaker players get trapped in rework cycles and LD exposure. In nuclear, the competitive edge is often defined by how quickly a provider can close findings into regulator-accepted packages without creating new interfaces, because each interface is a failure surface that increases schedule tail risk. On thermal end-of-life, advantage is increasingly held by teams that treat closure as a liability management project with stakeholder and remediation logic, rather than a demolition exercise.
Strategy pattern table
|
Winning play |
Who uses it (archetype) |
Why it works |
Where it fails |
What signal to watch |
|
Repeatable outage playbooks with strict configuration control |
Portfolio operators and their core contractors |
Reduces variance and limits rework loops |
When site-specific governance is weak |
Outage duration dispersion narrows over cycles |
|
Assurance-led contracting tied to evidence acceptance |
Banks and regulated operators |
Aligns incentives to acceptance timing |
When acceptance criteria are ambiguous |
Findings closure rate before outage start improves |
|
Qualified labor pipelines and training lock-in |
Tier-1 delivery organizations |
Lowers execution bottlenecks |
When utilization becomes too rigid |
Labor availability risk tier improves quarter to quarter |
|
Early closure readiness and liabilities mapping |
Thermal owners with closure timelines |
Avoids closure cost shocks |
When stakeholder constraints are ignored |
Scope change frequency drops after early studies |
|
Integrated risk register across OEM, EPC, operator |
Complex retrofit programs |
Reduces interface failure surfaces |
When accountability is diluted |
LD exposure band improves and disputes decline |
Key M&A Deals:
-
Cyclife took 100% ownership of Balcke-Dürr Nuklear Service, expanding its nuclear waste management, decommissioning engineering, and lifecycle services in Germany.
-
EDF strengthened its nuclear turbine technology, maintenance, and lifecycle capabilities through this acquisition, supporting reactor life extensions and decommissioning preparation.
-
Assystem sold its minority holding (~USD 223 million) in Framatome to EDF, consolidating EDF’s control over nuclear engineering, services, and asset lifecycle expertise.
-
Saipem and Subsea7 complete €6 billion merger, the creation of Saipem7 significantly boosted EPC capabilities for nuclear/thermal decommissioning, subsea infrastructure, and grid tie-ins related to asset lifecycle projects.
-
European Green Transition acquires leading UK/Ireland O&M platform, the acquisition of an operations & maintenance business servicing 900+ onshore turbines and thermal/nuclear-adjacent assets enhanced lifecycle and repowering services across mature fleets.
Key Private Equity Deals:
-
Pelican Energy Partners acquires GSE Systems, Houston PE firm took the nuclear simulation/training services provider private; bolsters lifecycle support amid SMR/nuclear revival.
-
IRDI/Bpifrance invests in Groupe D&S, minority stake in French nuclear services firm for maintenance and lifecycle extensions, tied to EU energy security.
-
Integrated Power Services acquires turbine services firm, $350M LBO for inspection/overhaul/maintenance in thermal/gas assets; minimizes downtime for industrial power.
-
NorthStar Group Services acquires Vallecitos Nuclear Center, decommissioning specialist takes ownership from GE Vernova for site restoration, modeled on Vermont Yankee success.
-
Private equity surge in advanced nuclear services, $783M across deals, doubling count; targets SMR lifecycle, fuel services, and thermal integration.
Key Development:
-
EU Nuclear Decommissioning Assistance Programme, €3B+ funding since 2021 for Bulgaria, Slovakia, Lithuania; focuses on physical dismantling, waste management, safety upgrades via EBRD/EBRD implementation.
-
France/UK life extensions and SMR push, EDF FR allocates for fleet modernization; Sweden lifts uranium ban (late 2024), Ringhals SMR projects.
-
Digital twins and predictive maintenance adoption across Europe; AI/IoT for real-time monitoring reduces outages, supports diverse reactor types amid stringent EU safety directives.
-
Robotics and waste tech innovations, advanced systems for dismantling, reprocessing spent fuel; emphasis on seismic retrofits, environmental monitoring in Western Europe decommissioning hubs.
Capital & Policy Signals
The policy signal is that lifecycle, not just build-out, is part of the reliability story, which is why decommissioning and end-of-life governance remains visible at EU level and why the finance community has clearer categorization frameworks than it did a few years ago. In practice, deal appetite rises for operators and delivery models that can demonstrate lower outage variance and credible evidence acceptance pathways, because those are the variables that de-risk cashflows under scrutiny. Funding patterns often contradict public narratives by being less about “technology bets” and more about underwriting execution systems, supplier qualification, and risk packaging that survives investment committee and credit committee interrogation.
Decision Boxes
IC/Investor Decision Box: Underwriting thresholds that actually move IC memos
When outage variance is rising because evidence acceptance and rework loops expand critical path risk, the downside case shifts from cost overrun to cashflow interruption, which shows up in wider availability bands and weaker dividend safety, so IC teams should set threshold discipline around schedule tail risk and proof readiness, not average maintenance spend.
Bank Decision Box: What changes DSCR and covenant comfort first
When the probability of extended outages increases due to documentation gaps and long-lead constraints, early cashflow timing becomes fragile and covenant headroom compresses, which shows up in stress cases that fail on timing rather than total cost, so banks should anchor DSCR comfort to credible outage recovery options and acceptance stress cases.
OEM Decision Box: Where specs, retrofits, and compliance budgets really shift
When operators face higher scrutiny on traceability and acceptance, specification choices move toward qualified parts and auditable processes, which shows up in procurement that prioritizes certification pathways and interface minimization, so OEMs should invest in qualification speed and documentation quality as core product value.
EPC Decision Box: Where delivery risk hides (scope, LDs, commissioning, availability)
When multi-party interfaces expand and commissioning depends on acceptance timing, delivery risk shifts from site productivity to governance and evidence closure, which shows up in LD exposure and post-outage performance disputes, so EPCs should price and manage interface risk with explicit quality gates and ownership clarity.
Operator Decision Box: What breaks in O&M and how it hits availability and opex
When ageing findings recur because root causes are not closed and configuration control drifts, forced outages increase and maintenance becomes reactive, which shows up in higher unplanned work and availability penalties, so operators should focus on repeat defect elimination, traceability, and disciplined workpack execution.
Methodology Summary
This Reality Pack builds a 2026–2030 view by translating asset base realities into serviceable work scopes and then stress-testing the conversion of scope into outcomes under regulatory, supply chain, and outage-window constraints. Forecast logic starts with market boundaries by asset type and lifecycle phase, then maps service lines to where economics and bankability are actually determined, such as outage execution, evidence acceptance, long-lead procurement, and closure liabilities. Public sources and disclosed datasets are used to triangulate country fleet presence and policy framing, while risk adjustments are applied by modelling schedule variance bands, acceptance rework probability, and availability impacts rather than producing false precision on spend.
A key limitation is that lifecycle outcomes are path-dependent and heavily influenced by site-specific governance and contractor quality, so the pack uses rank-order risk tiers and indexed indicators to reduce error without pretending to know plant-level specifics.
Analyst credibility box
The work is structured like an IC brief, starting from what changes cashflow risk and execution outcomes, then mapping evidence requirements, outage mechanics, and procurement constraints to bankability. The hardest data to verify consistently is plant-level outage variance drivers and supplier qualification depth, so the pack relies on triangulation and conservative risk tiering.
Limitations box
-
Plant-level scope is not fully observable ex ante, so findings-driven scope creep is treated probabilistically, not deterministically.
-
Regulatory acceptance timing varies by country and site, so the pack uses acceptance risk tiers rather than single timelines.
-
Supplier and labor availability can shift quickly, so lead-time exposure is expressed in bands and monitored via update logic.
-
Commercial terms are often confidential, so pricing is handled via sensitivity bands and contract archetypes, not point quotes.
What changed since last update
-
Updated policy and finance framing around taxonomy treatment of relevant activities.
-
Refreshed EU nuclear fleet presence and recent generation direction as a demand-side signal for lifecycle scrutiny.
-
Reflected the continuing pace and unevenness of coal exit signals that drive thermal end-of-life workstreams.
Source Map
-
Eurostat nuclear energy statistics and country fleet presence
-
European Commission nuclear decommissioning policy material
-
European Commission taxonomy regulation acts and guidance
-
National energy regulators and safety authority publications
-
TSO and DSO adequacy and outage coordination publications
-
Auction and capacity mechanism disclosures where applicable
-
OEM and EPC public technical disclosures and product qualification notes
-
Operator annual reports and maintenance commentary where disclosed
-
Publicly disclosed decommissioning program materials
-
Labor market and skills pipeline publications relevant to nuclear-qualified roles
-
Coal phase-out trackers and verified closure reporting
-
IAEA references on the centrality of long-term operation as a system-level requirement
Why This Reality Pack Exists
Generic reports usually describe a services spend pool and then attach growth narratives, but they rarely model the conversion from planned scope to accepted outcomes, which is where real value and real loss sit in lifecycle work. Decision teams need a view that treats outage variance, evidence acceptance, and closure liabilities as first-order underwriting variables, because those are what hit availability, penalties, and DSCR under scrutiny. A €2000 Reality Pack earns its place when it removes false precision, replaces it with decision-grade risk bands and proof objects, and shows where execution friction is mispriced so capital is not deployed against the wrong assumption.
What You Get
-
80–100 slide PDF designed for IC and credit committee reuse, with explicit risk bands, execution friction mapping, and decision boxes by stakeholder.
-
Excel Data Pack
-
20-minute analyst Q&A focused on interpreting risk bands, assumptions, and what the pack implies for screening and diligence priorities.
-
12-month major-policy mini-update highlighting changes that alter revenue certainty, compliance burdens, or bankability framing.
Snapshot: EU Nuclear & Thermal Asset Lifecycle Services 2025–2030
Reliability and compliance are becoming the priced outputs, because ageing fleets and public scrutiny increase the cost of variance, which shows up in tighter tolerance for outage slips and higher penalty sensitivity, so decision teams should treat execution systems as an asset, not overhead. Nuclear’s material role and concentration in specific EU countries keeps lifecycle actions highly visible and regulator-led, which shows up in evidence-heavy LTO workstreams and acceptance-driven schedules, so investors and banks should underwrite acceptance timing and outage variance as first-order drivers. Thermal lifecycle is fragmenting as coal exits and system needs diverge by country, which shows up in parallel demand for closure readiness and selective reliability upgrades, so owners should avoid one-size lifecycle plans and instead segment assets by closure liability, flexibility value, and permitting exposure.
Sample: What the IC-Ready Slides Look Like
-
One-page IC decision summary that ranks what moves value in this market by availability risk, acceptance risk, and closure liability.
-
Consensus-versus-reality view that contrasts spend-led narratives with outcome-led underwriting variables such as outage variance and acceptance timing.
-
Risk and mitigants layout that links execution failure surfaces to DSCR sensitivity bands and covenant comfort.
-
Opportunity map that segments whitespace by service line and by where proof objects can be delivered repeatably.
-
Deal-screen criteria page that converts technical diligence into committee-ready thresholds and red flags.
-
Sensitivity table showing how outage slippage bands and acceptance rework probability change cashflow timing risk.
-
Pipeline heat snippet that uses rank-order signals such as maintenance cycle intensity, closure readiness, and retrofit trigger conditions.
Why Purchase This Report?
IC-Defensible Thesis, Not “Market Size”
A decision frame you can take into committee: boundary, base case, and what would change our view.
Evidence Ladder You Can Audit
Artefacts-led (grid offers, tenders, term-sheet structures, warranty language), mapped to what each proves and where it fails.
IRR Kill-Shots and Early Signals
The repeatable ways projects miss IRR (timeline, capex, availability, settlement): plus the first signals that show up before the slide.
Regime Classes and Dominant Variables
Why identical assets underperform in different environments: the one variable that dominates returns by regime (payer, settlement, constraints, curtailment logic.
Table of Contents
EU Nuclear & Thermal Asset Lifecycle Services Market 2026–2030
1. Executive Brief/Summary (What Everyone’s Missing)
1.1 Market Size & Forecast (2025–2030)
1.2 Where Most Forecasts Go Wrong and Where the Money’s Actually Going
1.3 High-Level Opportunity Snapshot
2. Research Architecture & Field Intelligence
2.1 Research Methodology & Data Sources
2.2 Top 3 Growth Signals from Market Stakeholders
2.3 Execution Friction: Where Projects Fail in Reality
3. Demand Outlook
3.1 Key demand drivers, focused on what changes decisions
3.2 Underserved Buyer Segments & Use Cases
3.3 Procurement and Pricing Patterns
4. Opportunity and White Space Map
4.1 Two Priority Segments to Watch
4.2.Regions / verticals with high pain, low competition
4.3. Integration Gaps and Pricing Bands that still work
4.4. Top Risks & Practical de-risk Levers
5. Competitive Intelligence: Strategic Benchmarking
5.1 Market Share Breakdown: Key Players (2024/25E)
5.2 Who’s Gaining Share, and Why (Talent, M&A, Policy Edge)
5.3 Challenger Playbook: How Smaller Players Are Quietly Winning
5.4. Company Profiles
5.4.1. Company 1
5.4.2. Company 2
5.4.3. Company 3
5.4.4. Company 4
5.4.5. Company 5
5.5. Capital flows:
5.5.1. By Investor Type (VC, PE, Infra, Strategics)
5.5.2. Investment Patterns, M&A, JV, and Expansion Moves
6. Market Segmentation
6.1 By Asset Type
-
6.1.1 Nuclear Power Plants
-
6.1.2 Coal-Fired Thermal Power Plants
-
6.1.3 Gas-Fired Thermal Power Plants
-
6.1.4 Oil-Fired Thermal Power Plants
-
6.1.5 Others
6.2 By Lifecycle Phase
-
6.2.1 Operation & Routine Maintenance (O&M)
-
6.2.2 Life Extension & Long-Term Operation (LTO)
-
6.2.3 Safety Upgrades & Compliance
-
6.2.4 Decommissioning & Site Restoration
-
6.2.5 Others
6.3 By Service Category
-
6.3.1 Engineering & Technical Services
-
6.3.2 Inspection, Testing & Certification
-
6.3.3 Outage Management & Refueling Support
-
6.3.4 Waste Handling & Environmental Services
-
6.3.5 Others
6.4 By Contracting Model
-
6.4.1 Long-Term Framework Agreements
-
6.4.2 Project-Based Contracts
-
6.4.3 Performance-Based Contracts
-
6.4.4 Emergency & Ad-hoc Services
-
6.4.5 Others
6.5 By Geography
-
6.5.1 France
-
6.5.2 Germany
-
6.5.3 Spain
-
6.5.4 Sweden
-
6.5.5 Finland
-
6.5.6 Rest of Europe
7. Action Frameworks for 2025–2028
7.1 Market Entry Options by Archetype (Builders, Tech Entrants, Investors)
7.2 Three realistic GTM Patterns
7.3 Strategic Watchlist: What to Monitor Quarterly
8. IC-Ready Decision Pack (Slides You Can Reuse Directly)
8.1. One-page IC Summary (yes/no, where, how)
8.2. 4-5 IC slides you can re-use (market thesis, risk & mitigants, competition)
8.2. Cheat sheets
8.4 Country / Segment Prioritization Slide
8.5 “Go / No-Go” Checklist for 2025–2028
Appendix: Reference Frameworks & Background:
-
A1. Regulatory overview (high-level, with links to primary docs)
-
A2. PESTLE snapshot
-
A3. Porters (one slide max, if at all)
-
A4. Supply chain maps
-
A5. Price band tables
Research Methodology
No research methodology information available for this report.
Frequently Asked Questions
Research Grounded in Verifiable Inputs
Our research draws on publicly verifiable inputs including regulatory filings, grid operator data, project announcements, and policy documents across Europe.
These inputs are cross-checked through structured discussions with industry participants to validate what is progressing in practice versus what remains theoretical.
Analyst-Led Research Support
Each report is supported by analysts who focus on specific energy domains and regions. Clients can discuss assumptions, clarify findings, and explore implications with analysts who follow these markets on an ongoing basis
Energy Insights,
Straight to Your Inbox
For People Who Sign Off on Energy Decisions.
Short updates on EU power, grids, storage, and execution risk. No spam, just what matters.
Unsubscribe anytime. No spam, ever.