EU Nuclear Life-Extension Services Market 2026–2030: Uprate and Lifetime Economics Under Outage Windows, Supply-Chain Constraints, and Safety-Case Proof
Report Description
The EU Nuclear Life-Extension Services Market 2026–2030 is moving from “can the plant run longer” to “can the plant prove, schedule, and finance the extra years under tighter outage windows and fewer qualified suppliers”. Most underwriting misses that the binding constraint is often not the capex headline but the outage-critical path and the evidencing burden inside the safety case, which shifts both availability risk and bank comfort even when policy rhetoric is supportive.
In practice, capital is leaning toward life-extension programs that can convert engineering scope into predictable outage execution, because the economic upside shows up only if generation is not sacrificed to slippage and rework. The market is quietly bifurcating between fleets that can lock credible outage plans, qualified welding and NDE capacity, and regulator-ready documentation, versus those that look attractive on paper but become availability stories once the first long outage collides with component lead times and QA holds.
If you only change one assumption in your model, change: treat outage execution and evidencing throughput as the primary scarcity, not project capex.
Key Insights
- 1When qualified outage capacity tightens, return-to-service certainty deteriorates and this shows up as DSCR volatility, so underwriting should gate on outage governance maturity rather than on capex alone.
- 2If safety-case proof is treated as an afterthought, restart holds rise and this appears in prolonged outages, so banks and IC teams should demand evidence readiness controls before outage start.
- 3As obsolescence modernization compresses into short outages, commissioning time becomes scarce and defects surface, so OEM and EPC specs should prioritize testability and traceability that reduce rework risk.
- 4When outage calendars overlap across fleets, subcontractor scarcity increases and schedule risk becomes systemic, so operators and EPCs should secure qualified capacity early and price against scarcity rather than unit costs.
- 5If condition-based discoveries expand scope mid-outage, availability becomes the value driver and this shows up in generation loss, so models should stress scope growth archetypes instead of assuming fixed work scopes.
- 6Where contract structures align incentives to return-to-service outcomes, governance discipline improves and this shows up in fewer change-order spirals, so commercial strategy should allocate outage-delay risk explicitly.
- 7When records integrity is weak, proof throughput slows and this appears as QA closure delays, so operators should treat documentation readiness as a core asset that protects availability.
- 8If long-lead components are not mapped and mitigated, outages lengthen and this shows up in covenant stress, so financing and procurement should integrate lead-time risk into schedules and covenants.
- 9Where regulatory resourcing supports repeatable reviews, proof pathways stabilize and this shows up in fewer late questions, so investors should differentiate by regulator throughput signals rather than by political headlines.
Scope of the Study
Why do forecasts go wrong in the EU nuclear life-extension services market?
Most forecasts treat life-extension as a linear services demand curve tied to policy support and installed base, but the delivery reality is gated by outage windows and evidencing throughput.
Mechanism: critical-path outages require qualified labour, QA, and regulator-ready records; when any of these bottleneck, scope “spends” extra days offline.
Direction: availability risk rises faster than headline spend.
Where it shows up: deferred return-to-service dates, unplanned rework, and revised outage plans that compress subsequent maintenance.
Decision implication: models that do not stress outage slippage and documentation holds will overstate cashflow stability, understate DSCR volatility, and misprice contract structures for EPCs and service providers.
Where do nuclear life-extension projects fail in reality, even with funding and political support?
Failures cluster where engineering scope meets regulatory proof and outage execution. Mechanism: material condition discoveries, component lead-time surprises, and QA documentation gaps force redesigns and rework inside fixed outage windows.
Direction: schedule pressure shifts risk from “project completion” to “return-to-service certainty”.
Where it shows up: extended outages, constrained testing and commissioning time, and regulator questions that delay restart.
Decision implication: IC teams should treat evidencing and outage governance as bank-grade risk drivers, banks should stress availability covenants rather than capex overruns alone, and operators should prioritize supply-chain qualification and records readiness before outage start, not during it.
How an IC team screens this market?
-
Underwrite availability impact first, because life-extension value is realized only if outage plans hold.
-
Stress-test outage critical path, including NDE, welding qualification, and QA sign-off dependencies.
-
Check component lead-time and obsolescence exposure, especially for long-lead safety-relevant parts.
-
Look for regulatory proof readiness in the safety case, not just engineering scope maturity.
-
Validate counterparty capacity, since qualified suppliers are the real constraint in peak outage seasons.
-
Map DSCR sensitivity to outage slippage and uprate timing, not to capex alone.
-
Require contract structures that allocate outage-delay risk cleanly across operator, EPC, and specialist vendors.
Market Dynamics
Life-extension demand is anchored in an ageing European fleet and in the economics of retaining firm low-carbon capacity, but the service market behaves less like “maintenance” and more like a constrained project delivery system. Condition-based scope expansion is not a tail risk; it is structurally likely because deeper inspections during planned outages surface degradation, obsolescence, and design-basis evidence gaps, and the knock-on effect is that execution risk concentrates into a small number of outage weeks where each day offline has direct revenue and balancing-cost consequences.
On the supply side, the market is tightening around qualified labor, QA disciplines, and component traceability, which favors suppliers that can prove nuclear-grade processes repeatedly and absorb peak outage demand. Policy signals matter, but mostly through how they change operator decision speed and regulator resourcing, because a supportive stance does not remove the proof burden and it does not create qualified capacity quickly. Where investors overestimate certainty is assuming that political backing translates into schedule certainty; where they underestimate upside is in fleets that have built repeatable outage governance and supply-chain qualification that compresses return-to-service risk.
Technology-wise, the practical transitions that matter by 2030 are not exotic new builds, but uprates, digital I&C modernization, materials upgrades, and monitoring that reduce inspection uncertainty, because these changes show up as fewer “surprise findings” mid-outage and fewer documentation disputes at restart.
Driver Impact Table
|
Driver statement |
Where it is most relevant in EU-27 + UK |
Timeframe |
Who it impacts most |
Impact band on economics |
How we measure it in the pack |
|
Uprate and life-extension programs that monetize firm capacity value when outages are controlled |
Markets with tight capacity margins and high value of firm generation |
2026–2030 |
Operators, IC teams, banks |
DSCR sensitivity: Medium to High |
Outage plan credibility scoring, return-to-service probability bands, availability stress cases |
|
Ageing component obsolescence pushing accelerated replacement and modernization spend |
Fleet segments with legacy I&C and constrained spares ecosystems |
2026–2029 |
OEMs, specialist integrators, operators |
Capex band sensitivity: Medium |
Obsolescence mapping, long-lead list, supplier qualification density by work package |
|
Regulator resourcing and standardization improving review throughput for repeatable life-extension cases |
Jurisdictions with established fleet governance and stable regulatory cadence |
2026–2030 |
Operators, banks |
DSCR sensitivity: Medium |
Review cycle time bands, evidence package completeness indicators, restart hold drivers |
|
Contracting models shifting risk to those who can manage outage critical path |
Across the region where qualified capacity is scarce |
2026–2030 |
EPCs, OEMs, operators |
Months of queue delay risk: Medium |
Contract archetype benchmarking, LD and availability allocation patterns, outage critical-path ownership |
|
Condition monitoring and inspection tech reducing mid-outage surprises when integrated into governance |
Fleets investing in predictive maintenance and records readiness |
2027–2030 |
Operators, service vendors |
Opex and availability impact: Low to Medium |
Inspection scope volatility index, rework triggers, documentation rework rate bands |
Drag Impact Table
|
Drag statement |
Where it is most relevant in EU-27 + UK |
Timeframe |
Who it impacts most |
Impact band on economics |
How we measure it in the pack |
|
Outage-window congestion and qualified labor scarcity stretching schedules |
Peak outage seasons across multiple fleets |
2026–2030 |
Operators, EPCs, banks |
Months of outage slippage: Medium to High |
Labor qualification capacity map, outage overlap heat map, slippage probability bands |
|
Nuclear-grade component lead times and QA documentation holds delaying restart |
Work packages with safety-relevant parts and tight traceability rules |
2026–2030 |
OEMs, operators, banks |
DSCR sensitivity: High |
Long-lead lead-time bands, QA release hold drivers, restart delay stress tests |
|
Late discovery of material condition and design-basis evidence gaps expanding scope |
Older units with incomplete historical records |
2026–2030 |
Operators, IC teams |
Availability impact: High |
Condition discovery frequency bands, scope growth archetypes, evidence gap taxonomy |
|
Policy volatility affecting operator decision speed and workforce pipeline |
Markets with shifting political cycles and planning uncertainty |
2026–2030 |
Investors, operators |
Economics impact: Medium |
Policy durability scoring, operator capex gating indicators, supplier pipeline confidence bands |
|
Waste and spent fuel handling constraints complicating outage and maintenance planning |
Locations where backend constraints tighten operational flexibility |
2026–2030 |
Operators, regulators |
Opex and schedule impact: Low to Medium |
Constraint register, outage planning flexibility score, compliance work package mapping |
Opportunity Zones & White Space
The clearest white space sits where life-extension scope can be packaged into repeatable outage workbanks and evidence bundles, because the market pays for return-to-service certainty even when procurement teams focus on day rates. In EU fleets with ageing documentation and mixed-vendor legacy systems, providers that can couple engineering changes with regulator-ready proof and QA completeness can win not by being cheapest, but by reducing the probability that a restart is held for paperwork, testing gaps, or traceability questions.
A second opportunity pattern is emerging around obsolescence and digital modernization that shortens future outages rather than just replacing parts, because the economic value shows up as fewer corrective discoveries mid-outage and fewer commissioning surprises at restart. This favors integrators that understand nuclear QA and operational constraints, not generic industrial automation, and it is where incumbent procurement assumptions can be wrong since the technical deliverable is only valuable if it reduces outage risk, not if it merely upgrades equipment.
A third pocket is service capacity orchestration across clustered outage calendars, because multi-plant scheduling is becoming a competitive advantage in itself, and providers that can secure qualified labor and NDE capacity ahead of peak seasons can price against scarcity rather than against unit cost.
A fourth white space is bank-facing risk packaging, where projects that translate outage governance into covenant comfort can broaden financing appetite, because DSCR volatility is often driven more by time offline than by capex deviations.
Market Snapshot: By Reactor type, Service and Service providers
Mini Case Pattern
Pattern: From diligence to cashflow, where this market surprises teams
A fleet operator runs a life-extension package that includes a uprate-linked turbine and balance-of-plant retrofit alongside safety-case updates during a planned outage. Diligence assumes the main risk is capex control and that proven vendors mean predictable delivery. In execution, inspection findings expand scope in safety-relevant systems and the restart timeline becomes gated by QA documentation closure and regulator-facing evidence completeness rather than by physical installation. The friction point is not one defect but the accumulation of small holds across traceability, testing records, and late design clarifications that compress commissioning time and push return-to-service. For IC, the underwriting lesson is to price availability and restart hold risk as a primary driver of value. For the bank, covenant comfort hinges on outage governance evidence, not just sponsor strength. For the operator, records readiness and supplier qualification before outage start is the lever that protects generation.
Competitive Reality
Share is consolidating around archetypes that can repeatedly deliver inside outage windows with nuclear-grade QA and documentation discipline, because the buyer’s real pain is return-to-service uncertainty, not the average service invoice. Players that rely on opportunistic staffing or generic industrial capability lose relevance when outage seasons overlap and the market begins to price qualified capacity as scarce. Challenger strategies that work are those that specialize in bottleneck work packages, such as qualified welding, NDE, I&C modernization under nuclear QA, and evidence package preparation, then expand through reliability and restart outcomes rather than through portfolio breadth.
Capital flow patterns reward predictable outage execution, so M&A and partnership logic often targets capabilities that tighten the critical path and reduce restart holds. Quiet winners are the providers that can show repeatable governance, records control, and commissioning discipline across multiple outages, because that is what turns political tailwinds into cashflow stability.
Strategy pattern table
|
Winning play |
Who uses it (archetype) |
Why it works |
Where it fails |
What signal to watch |
|
Own the outage critical path through integrated workbanks and QA closure |
Nuclear specialist integrator |
Converts scope into return-to-service certainty, which buyers value most |
Breaks when supplier qualification is thin and peak season overlaps |
Restart holds and rework rates by work package |
|
Lock qualified labor and NDE capacity ahead of outage seasons |
Capacity orchestrator |
Prices scarcity, prevents schedule collapse under overlap |
Fails if demand softens or labor mobility shifts |
Outage calendar overlap and subcontractor retention |
|
Package evidence and safety-case updates as a deliverable, not an afterthought |
Proof-first specialist |
Reduces regulator friction and documentation-driven delays |
Fails if operator records are poor and interfaces are unmanaged |
Evidence completeness at outage start and change-control discipline |
|
Focus on obsolescence modernization that shortens future outages |
I&C modernization specialist |
Creates economic value through reduced future outage volatility |
Fails if commissioning windows are too compressed |
Commissioning defect density and punch-list closure speed |
|
Use contract structures that align incentives to return-to-service outcomes |
Outcome-aligned EPC archetype |
Forces discipline on schedule and QA closure |
Fails when scope uncertainty is unmanaged |
LD triggers, availability clauses, and scope-change frequency |
Recent M&A Deals:
EDF acquires strategic stake in GE Vernova’s Steam Power nuclear business, EDF strengthened its turbine and lifecycle services for reactor life extensions across Europe and the UK, enhancing LTO support for existing fleets.
Cyclife acquires Balcke-Dürr Nuklear Service, Cyclife expanded its nuclear services portfolio, adding specialised engineering and maintenance capabilities that support life-extension inspections and upgrades.
Framatome acquires Velan SAS, Segault, and Vanatome, Framatome consolidated high-performance valve supply chain assets critical for nuclear plant life-extension upgrades and safety systems.
Framatome acquires remaining stake in Reaktortest, Framatome gained full control of the non-destructive examination specialist, bolstering LTO inspection and aging management services across Europe.
Assystem divests 5% Framatome stake back to EDF, The divestment consolidated EDF’s control over nuclear engineering and LTO services, streamlining supply-chain and project delivery for life extensions.
Recent Private Equity Deals:
-
Ares backed Eni’s platform with exposure to nuclear-adjacent services and life-extension support in European markets.
-
KKR invested in Eni’s low-carbon energy arm, which includes services and infrastructure linked to nuclear fleet life extensions.
-
Ardian acquired the Irish energy provider with grid and nuclear-adjacent service capabilities supporting LTO projects.
-
CVC took majority ownership in Low Carbon, whose portfolio includes nuclear-adjacent infrastructure and services relevant to life-extension programmes.
-
EQT’s fund allocated capital to energy transition assets, including platforms with nuclear LTO and modernisation exposure.
Key Development:
-
The French nuclear safety authority granted approval for 20 of EDF’s 1,300 MW reactors to operate up to 50 years, covering sites like Belleville, Cattenom, and Paluel. This triggered large-scale upgrade contracts and boosted demand for LTO services.
-
Belgium repealed its phase-out law and approved life extensions for its remaining reactors, creating new service contracts for inspections, safety upgrades, and component replacements.
-
The European Commission’s updated PINC report emphasised lifetime extensions as a critical, low-cost way to maintain capacity, estimating €36 billion specifically for LTO programmes across the EU by 2050.
-
The UK regulator progressed long-term operation approvals and made life-extension projects eligible for Contracts for Difference support from mid-2025, unlocking new service and upgrade contracts.
-
The European Nuclear Society warned that premature shutdowns would be unaffordable and urged integration of life-extension programmes into national energy strategies to preserve low-carbon baseload.
Capital & Policy Signals
In this market, “policy support” is not the signal that matters most, because cashflow stability is determined by whether outage execution can be made repeatable under regulator proof. The useful signal is whether operators are committing to multi-year life-extension portfolios with governance structures that institutionalize records readiness, supplier qualification, and outage sequencing, since that is the behavior change that reduces availability volatility and improves bankability.
Funding patterns often contradict public narratives by favoring programs that de-risk return-to-service rather than the most ambitious scope, because the risk that kills value is time offline and restart delay, which shows up directly in DSCR stress cases. The risks ICs should discount are broad “political noise” that does not change operational proof requirements, while the risks they should overweigh are supplier capacity concentration, long-lead component exposure, and evidence package readiness that can turn a planned outage into a multi-month revenue event.
Decision Boxes
IC/Investor Decision Box: Underwriting thresholds that actually move IC memos
When outage-critical path work is capacity-constrained, restart certainty tightens and availability volatility rises, which shows up in stressed cashflow more than in capex variance, so IC memos should gate investment on outage governance maturity, qualified supplier depth, and evidence readiness rather than on the headline life-extension budget.
Bank Decision Box: What changes DSCR and covenant comfort first
If return-to-service timing is sensitive to QA closure and regulator proof, DSCR headroom becomes a function of outage slippage bands, which appears in covenant stress under low-availability cases, so covenant comfort improves first when sponsors can evidence restart hold controls, long-lead mitigation, and commissioning discipline.
OEM Decision Box: Where specs, retrofits, and compliance budgets really shift
As obsolescence and modernization scope concentrates into short outage windows, specification decisions move toward installability, testability, and traceability under nuclear QA, which shows up in change-order rates and commissioning defects, so budgets should prioritize designs that reduce rework and records friction.
EPC Decision Box: Where delivery risk hides (scope, LDs, commissioning, availability)
When inspection findings expand scope mid-outage, delivery risk shifts into interface control and late-stage testing time, which appears in LD exposure and availability-linked clauses, so EPCs should protect margin by hardening change-control, pre-qualifying subcontractors, and ring-fencing commissioning windows.
Operator Decision Box: What breaks in O&M and how it hits availability and opex
If life-extension changes are not integrated into maintenance records and spares strategy, corrective work rises and outage planning becomes reactive, which shows up in forced outage frequency and higher contracted services reliance, so operators should treat records integrity and spares qualification as availability assets.
Methodology Summary
This pack builds a 2026–2030 outlook by modelling life-extension services demand as a function of fleet eligibility, operator program sequencing, outage calendars, and the binding constraints of qualified capacity and regulatory evidencing. Forecast logic is anchored in service work-package archetypes, outage-duration and overlap stress cases, and capex and opex bands tied to scope maturity and obsolescence exposure, then translated into scenario ranges rather than single-point certainty. Assumptions are validated through public disclosures, regulatory artefacts, outage and availability signals, supply-chain and qualification constraints, and cross-checks between operator plans and deliverable feasibility within typical outage windows.
The methodology reduces forecast error versus generic research by treating return-to-service probability as a primary variable, applying risk adjustments to availability and schedule, and separating “spend potential” from “deliverable capacity”. Limitations are handled explicitly by using bands, indices, and ranked sensitivities rather than invented point estimates.
Analyst credibility box
Work is structured like an IC diligence note: define market boundaries, build driver-led scenarios, stress outage execution and evidencing pathways, and translate delivery risk into cashflow risk. The hardest data to verify consistently is outage-critical-path capacity, documentation hold drivers, and the real restart gating items that sit outside public capex summaries.
Limitations box
-
Outage discovery risk cannot be known ex ante, so the pack uses scope-growth archetypes and stress bands.
-
Supplier capacity and qualification depth can change quickly, so constraints are treated as time-bound and scenario-driven.
-
Regulatory review timelines vary by jurisdiction and case complexity, so proof throughput is modelled as a range.
-
Operator disclosures are uneven, so cross-checks rely on multiple public artefacts and consistency tests.
What changed since last update
-
Greater emphasis on outage overlap and qualified-capacity congestion as the binding constraint in 2026–2030.
-
Higher weighting to evidencing and QA closure as restart drivers rather than pure engineering completion.
-
Expanded treatment of obsolescence and I&C modernization as availability-risk levers.
Source Map
-
National nuclear safety regulators and licensing documentation
-
Operator annual reports, investor presentations, and fleet operating updates
-
Outage scheduling disclosures and availability reporting signals
-
Nuclear industry bodies and safety standard references
-
Public procurement notices and tender documentation
-
Component qualification and certification frameworks
-
Engineering and inspection standards relevant to nuclear QA
-
Public policy statements and energy security frameworks in EU-27 and UK
-
Financial disclosure patterns tied to outage impacts and maintenance provisioning
-
Decommissioning, waste handling, and backend constraint disclosures where relevant
-
Grid and market context for firm generation value without mixing global figures
-
Academic and technical literature on ageing management and life-extension proof practices
Why This Reality Pack Exists
Generic syndicated reports treat nuclear life-extension as a services spend story and then extrapolate, but decision teams get hurt by what those reports do not model: outage execution bottlenecks, evidencing throughput, and restart gating that convert engineering scope into availability risk. This Reality Pack exists to correct that blind spot by translating delivery friction into DSCR and covenant relevance, so IC teams can underwrite reality rather than optimism and operators, EPCs, OEMs, and banks can align scope, contracts, and governance to return-to-service certainty. At €2000, the value is reliable directional clarity on what actually moves outcomes in 2026–2030, not a recycled market narrative.
What You Get
-
80–100 slide PDF built for IC committees, with investment logic, risk bands, and market-native work-package structure
-
Excel Data Pack
-
20-minute analyst Q&A to stress-test your assumptions and highlight where your model is exposed
-
12-month major-policy mini-update focused on policy durability and material changes to deliverable feasibility
Snapshot: EU Nuclear Life-Extension Services Market 2025–2030
The installed base is an operating fleet where the economic case for extending life depends less on abstract energy security narratives and more on whether outage execution can be made repeatable under tightening qualified-capacity constraints. Growth through 2030 is shaped by operators sequencing multi-year programs into finite outage windows, so demand appears lumpy and calendar-driven rather than smooth, and the decision implication is that delivery capacity and governance determine revenue capture more than headline policy support. Policy levers matter where they stabilize operator commitment and regulator throughput, but operationally the risk bands are set by long-lead components, QA closure, and evidence readiness that can turn planned outages into prolonged offline periods. What is changing is that modernization and obsolescence work is being judged by its ability to reduce future outage volatility, not by technical novelty, which shifts procurement toward proof-first vendors and away from generic industrial capability. The next five years matter because outage overlap and supplier scarcity are likely to tighten before new qualified capacity scales, making availability risk the primary pricing and financing variable.
Sample: What the IC-Ready Slides Look Like
-
One-page IC decision summary translating outage and proof constraints into underwriting exposure
-
Consensus versus reality chart contrasting “spend potential” with “deliverable capacity under outage windows”
-
Risk and mitigants layout linking restart holds to covenant stress cases and mitigation controls
-
Opportunity map showing where proof readiness and qualified capacity create pricing power
-
Deal-screen criteria sheet for outage governance, supplier qualification depth, and long-lead mitigation
-
Sensitivity table ranking DSCR exposure to outage slippage bands versus capex bands
-
Pipeline heat snippet using outage calendar overlap and work-package bottleneck scoring as leading indicators
Why Purchase This Report?
IC-Defensible Thesis, Not “Market Size”
A decision frame you can take into committee: boundary, base case, and what would change our view.
Evidence Ladder You Can Audit
Artefacts-led (grid offers, tenders, term-sheet structures, warranty language), mapped to what each proves and where it fails.
IRR Kill-Shots and Early Signals
The repeatable ways projects miss IRR (timeline, capex, availability, settlement): plus the first signals that show up before the slide.
Regime Classes and Dominant Variables
Why identical assets underperform in different environments: the one variable that dominates returns by regime (payer, settlement, constraints, curtailment logic.
Table of Contents
EU Nuclear Life-Extension Services Market
1. Executive Brief/Summary (What Everyone’s Missing)
1.1 Market Size & Forecast (2025–2030)
1.2 Where Most Forecasts Go Wrong and Where the Money’s Actually Going
1.3 High-Level Opportunity Snapshot
2. Research Architecture & Field Intelligence
2.1 Research Methodology & Data Sources
2.2 Top 3 Growth Signals from Market Stakeholders
2.3 Execution Friction: Where Projects Fail in Reality
3. Demand Outlook
3.1 Key demand drivers, focused on what changes decisions
3.2 Underserved Buyer Segments & Use Cases
3.3 Procurement and Pricing Patterns
4. Opportunity and White Space Map
4.1 Two Priority Segments to Watch
4.2.Regions / verticals with high pain, low competition
4.3. Integration Gaps and Pricing Bands that still work
4.4. Top Risks & Practical de-risk Levers
5. Competitive Intelligence: Strategic Benchmarking
5.1 Market Share Breakdown: Key Players (2024/25E)
5.2 Who’s Gaining Share, and Why (Talent, M&A, Policy Edge)
5.3 Challenger Playbook: How Smaller Players Are Quietly Winning
5.4. Company Profiles
5.4.1. Company 1
5.4.2. Company 2
5.4.3. Company 3
5.4.4. Company 4
5.4.5. Company 5
5.5. Capital flows:
5.5.1. By Investor Type (VC, PE, Infra, Strategics)
5.5.2. Investment Patterns, M&A, JV, and Expansion Moves
6. Market Segmentation
6.1 By Service Type
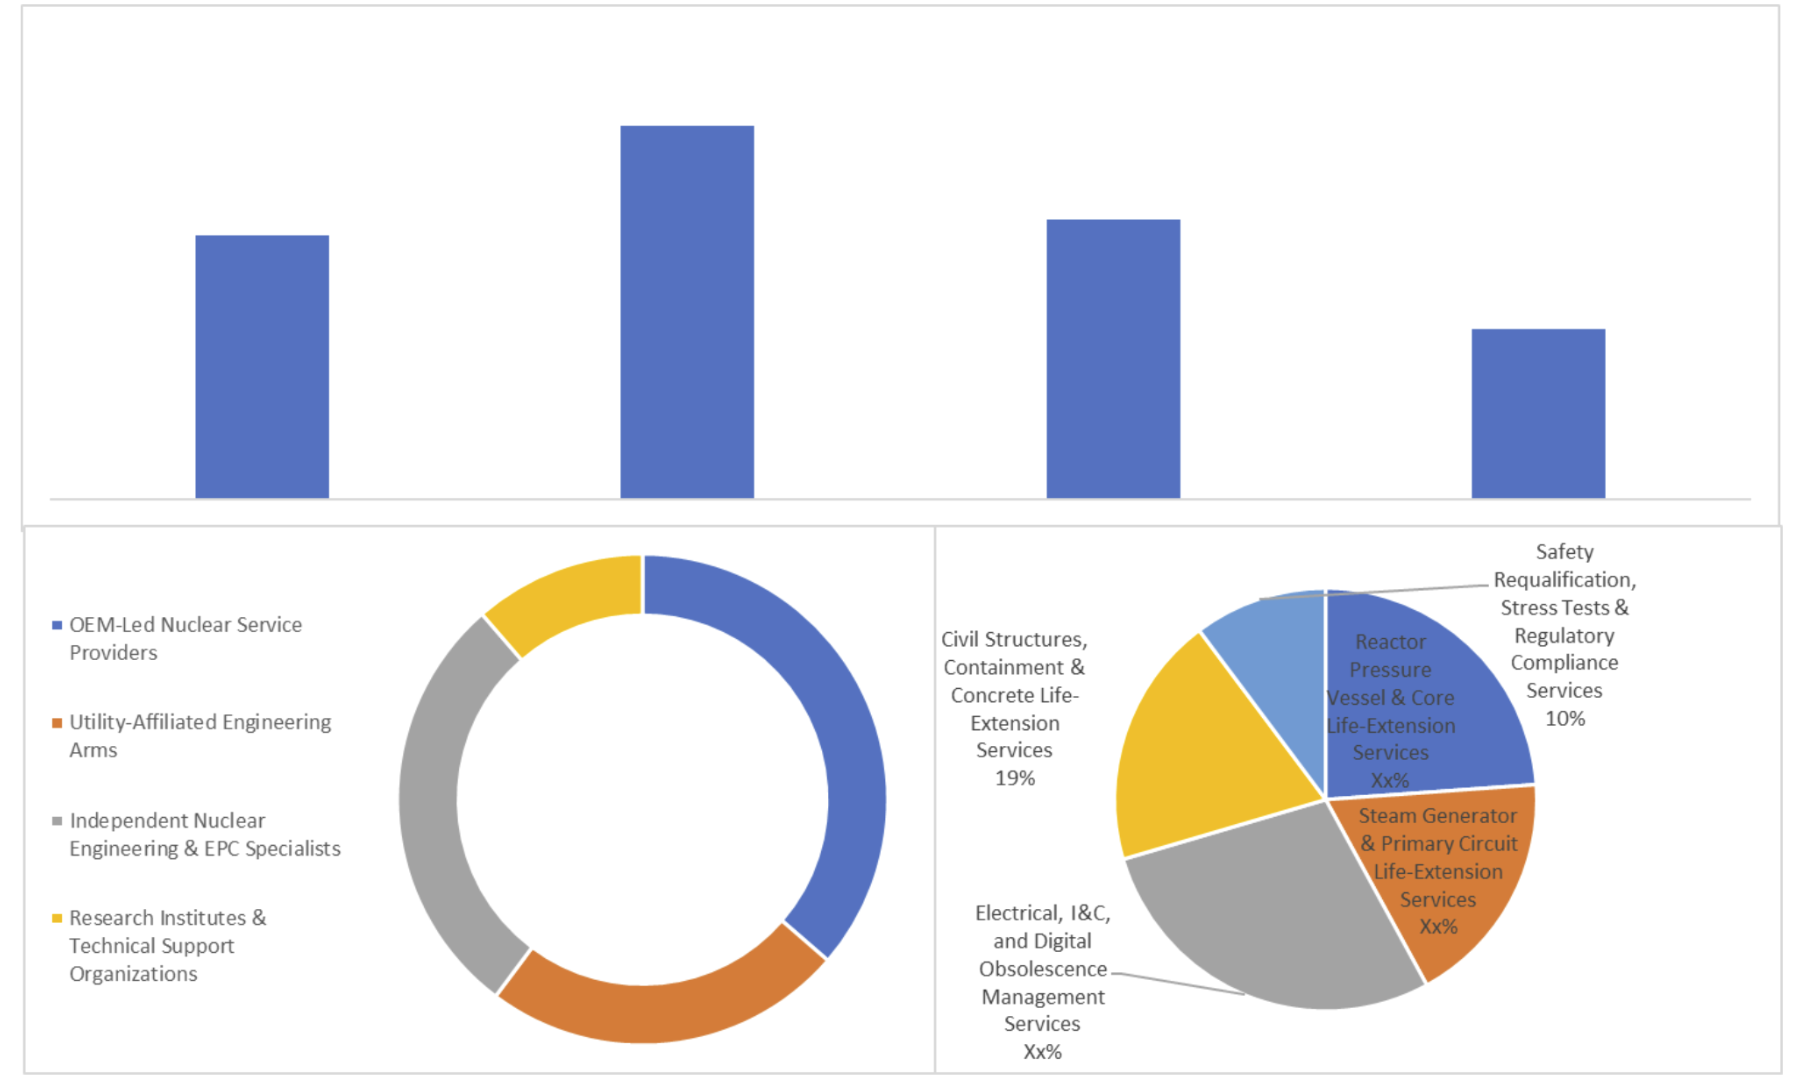
6.1.1 Reactor Pressure Vessel & Core Life-Extension Services
6.1.2 Steam Generator & Primary Circuit Life-Extension Services
6.1.3 Electrical, I&C, and Digital Obsolescence Management Services
6.1.4 Civil Structures, Containment & Concrete Life-Extension Services
6.1.5 Safety Requalification, Stress Tests & Regulatory Compliance Services
6.1.6 Others
6.2 By Reactor Type
6.2.1 Pressurized Water Reactors (PWR)
6.2.2 Boiling Water Reactors (BWR)
6.2.3 Pressurized Heavy Water Reactors (PHWR)
6.2.4 Gas-Cooled Reactors (AGR & legacy)
6.2.5 Others
6.3 By Plant Age / Extension Phase
6.3.1 First Life-Extension (30–40 Years)
6.3.2 Second Life-Extension (40–50 Years)
6.3.3 Beyond 50 Years Operation
6.3.4 Others
6.4 By Service Provider Type
6.4.1 OEM-Led Nuclear Service Providers
6.4.2 Utility-Affiliated Engineering Arms
6.4.3 Independent Nuclear Engineering & EPC Specialists
6.4.4 Research Institutes & Technical Support Organizations
6.4.5 Others
6.5 By Geography
6.5.1 France
6.5.2 Germany
6.5.3 United Kingdom
6.5.4 Sweden
6.5.5 Finland
6.5.6 Rest of Europe
7. Action Frameworks for 2025–2028
7.1 Market Entry Options by Archetype (Builders, Tech Entrants, Investors)
7.2 Three realistic GTM Patterns
7.3 Strategic Watchlist: What to Monitor Quarterly
8. IC-Ready Decision Pack (Slides You Can Reuse Directly)
8.1. One-page IC Summary (yes/no, where, how)
8.2. 4-5 IC slides you can re-use (market thesis, risk & mitigants, competition)
8.2. Cheat sheets
8.4 Country / Segment Prioritization Slide
8.5 “Go / No-Go” Checklist for 2025–2028
Appendix: Reference Frameworks & Background:
-
A1. Regulatory overview (high-level, with links to primary docs)
-
A2. PESTLE snapshot
-
A3. Porters (one slide max, if at all)
-
A4. Supply chain maps
-
A5. Price band tables
Research Methodology
No research methodology information available for this report.
Frequently Asked Questions
Research Grounded in Verifiable Inputs
Our research draws on publicly verifiable inputs including regulatory filings, grid operator data, project announcements, and policy documents across Europe.
These inputs are cross-checked through structured discussions with industry participants to validate what is progressing in practice versus what remains theoretical.
Analyst-Led Research Support
Each report is supported by analysts who focus on specific energy domains and regions. Clients can discuss assumptions, clarify findings, and explore implications with analysts who follow these markets on an ongoing basis
Energy Insights,
Straight to Your Inbox
For People Who Sign Off on Energy Decisions.
Short updates on EU power, grids, storage, and execution risk. No spam, just what matters.
Unsubscribe anytime. No spam, ever.