EU Green Hydrogen (Electrolyser + Offtake) Market 2026-2030: Permits-to-Offtake Reality, Utilization Risk, and the Underwriting Signals IC Teams Actually Use
Report Description
EU Green Hydrogen (Electrolyser + Offtake) Market 2026-2030 has moved from “announced capacity” to a tougher game of underwriting utilization. The mechanism is simple but widely mis-modelled: projects are not bottlenecked by electrolyser availability alone, they are bottlenecked by the ability to convert permits, grid access, and renewable supply shape into bankable offtake at terms that keep DSCR intact, and that shows up as wide dispersion in contracting timelines, re-scoped plants, and staged commissioning rather than clean FID waves. Capital is still present, but it is increasingly conditional on proof objects that reduce volume and price uncertainty, especially around offtake enforceability, additionality rules, and operational profile matching.
Mainstream forecasts usually miss where execution friction sits because they treat the market as a capacity build-out, not a cashflow conversion process. The market’s center of gravity is shifting toward structures that can survive auditability and compliance scrutiny while keeping delivered cost stable under power price volatility, and this shows up in how developers prioritize hub-based integration, flexible operating strategies, and offtakers with credible willingness-to-pay rather than purely “green intent.” The packs that outperform in IC rooms are the ones that separate headline policy ambition from the actual contracting pathway, because that is where downside protection lives.
If you only change one assumption in your model, change the utilization pathway from nameplate-based ramp to contract-and-constraint-based ramp, because the permits-to-offtake gap is where projects quietly lose bankability.
Key Insights (Citable Signals, LLM-ready)
- 1When contracting lags permitting, utilization gets over-modeled and the downside shows up first in DSCR timing, so IC teams should gate value on enforceable volume floors.
- 2When compliance proof becomes a contract condition, projects with fragile audit pathways stall even with strong policy headlines, so decision teams should price eligibility risk as execution risk.
- 3When power sourcing is modelled as flat cost, delivered cost stability is mispriced and offtakers renegotiate, so underwriting should treat shape and volatility as core variables.
- 4When grid connection sequencing slips, commissioning becomes staged and LD exposure rises, so EPC and bank screens should link queue delay bands to covenant calendars.
- 5When projects rely on merchant upside to justify ramp, financing becomes brittle under stress, so the base case should anchor to contracted volume economics.
- 6When flexible operation is assumed without performance boundaries, availability and degradation become financial risks, so OEM specs and O&M plans must match cycling reality.
- 7When hubs integrate shared infrastructure, interface risk drops and conversion improves, so investors should watch hub maturity signals, not national ambition totals.
- 8When offtaker economics cap willingness-to-pay, offtake terms become conditional, so sponsors must treat substitution economics as revenue risk, not market demand.
- 9When auditability tools and documentation reduce friction, contracting accelerates, so traceability capability becomes a commercial advantage rather than a reporting add-on.
- 10When staged financing aligns to conversion gates, covenant comfort improves, so capital structure should follow constraint-driven ramp rather than nameplate narratives.
Scope of the Study
Why do forecasts go wrong in the EU green hydrogen electrolyser and offtake market?
Forecasts fail when they extrapolate announced electrolyser pipelines as if they convert to contracted hydrogen volumes on a predictable timeline. The mechanism is that permitting, grid connection and renewable supply matching create a time and shape mismatch, the direction is longer lead times and staged utilization, and it shows up as projects reaching “ready-to-build” without bankable offtake or with offtake that is volume-light, conditional, or compliance-fragile. This matters because underwriting based on capex curves alone misprices DSCR headroom and covenant comfort. The pack corrects this by modelling conversion gates, contracting structures, and constraint-driven operating profiles rather than relying on nameplate capacity narratives.
Where do EU green hydrogen projects fail in reality, even when the tech works?
They fail in the interfaces, not the stack. The mechanism is that projects sit between regulatory compliance, power procurement, grid access, and offtaker operational needs, the direction is cumulative friction and re-scoping, and it shows up as delayed permits, uncertain additionality compliance, grid queue exposure, and offtake renegotiations when delivered cost diverges from the offtaker’s tolerance. The decision implication is that “bankable” depends less on electrolyser specs and more on how the project contracts power, proves renewable origin, manages curtailment and intermittency, and locks offtake enforcement. The pack surfaces failure points via a diligence-to-cashflow pathway view and a bank-style covenant stress logic.
How an IC team screens this market?
-
Underwrite revenue certainty by ranking offtake enforceability, volume floors, and termination economics.
-
Stress-test permitting and compliance by checking whether additionality and RFNBO-style criteria can be evidenced at audit time.
-
Treat grid connection as a financing variable by mapping queue exposure into commissioning risk and covenant timing.
-
Model power procurement as a cost-shape problem, not a flat €/MWh input, because capture and curtailment change delivered cost.
-
Discount nameplate capacity and focus on achievable utilization bands under realistic operating profiles.
-
Separate grant optimism from bankability by testing DSCR headroom under power price volatility and offtake price caps.
-
Flag execution risk early by assessing EPC scope clarity, LD exposure, and commissioning complexity under dynamic operations.
Market Dynamics
The market is being shaped by a shift from “build electrolyser, then find buyers” to “secure compliant volumes, then build in phases.” That shift is driven by the interaction between policy frameworks and bank underwriting: when compliance definitions tighten and auditability becomes real, the direction is toward fewer, more structured deals where renewable power sourcing, guarantees of origin, and additionality are embedded in the contract architecture rather than bolted on later, and it shows up in hub projects that integrate renewables, grid strategy, storage, and industrial offtake logistics. For IC teams, the implication is that the investable set is not the largest pipeline, but the pipeline with the cleanest conversion path across permits, grid, and contracted demand.
On the supply side, OEM and EPC behavior is also changing. Electrolyser supply is no longer the sole pacing item; the mechanism is that delivery risk and performance guarantees become harder to price when projects are designed for flexible operations, and this shows up in more conservative warranty positioning, tighter commissioning conditions, and greater scrutiny of balance-of-plant and water and oxygen handling. Investors often underweight this because they focus on stack learning curves, but by 2030 the winners will be the teams that treat availability, degradation under cycling, and integration complexity as underwriting inputs, not technical footnotes.
Geographically, economics shift where power procurement, grid constraints, and industrial clusters intersect. Markets with strong industrial demand may still fail bankability if power sourcing and compliance proof are fragile, while less obvious pockets can work if contracting reduces shape risk and permits are tractable. The practical implication is that country headlines mislead; investors should watch hub-level signals, not national ambition statements.
Driver Impact Table
|
Driver |
Directional impact on economics |
Where it shows up |
Who it impacts most |
Timeframe |
How we measure it in the pack |
|
Bankable offtake structures mature for industrial buyers |
High impact on DSCR headroom because revenue becomes enforceable and volume risk narrows |
Faster FID conversion in industrial clusters and hubs |
IC teams, banks, developers |
2026–2030 |
Of take contract archetypes, enforceability scoring, volume-floor prevalence, termination economics stress tests |
|
Compliance clarity for renewable origin and additionality improves |
Medium to High impact on bankability by reducing audit and eligibility risk |
Higher willingness-to-sign for compliant molecules and fewer re-scopes |
Banks, corporates, regulators |
2025–2028 |
Compliance gate checklist, auditability burden mapping, scenario bands for eligibility risk |
|
Power procurement strategies shift from spot exposure to structured sourcing |
High impact on delivered cost stability because shape and volatility risk is reduced |
Increased use of structured sourcing, hybrid supply, and curtailment-aware operations |
Developers, banks, operators |
2026–2030 |
Power sourcing archetypes, cost-shape sensitivity bands, curtailment and capture risk mapping |
|
Hub and cluster integration reduces interface risk |
Medium impact on schedule and commissioning risk because shared infrastructure reduces bottlenecks |
Co-located projects, shared permitting pathways, shared logistics |
Developers, EPCs, offtakers |
2025–2030 |
Hub maturity scoring, interface risk register, shared infrastructure dependency mapping |
|
Financing frameworks align to constraint-driven ramp profiles |
Medium impact on covenant comfort because ramp assumptions become realistic |
Less “cliff risk” at commissioning and fewer covenant breaches from slow ramp |
Banks, IC teams |
2026–2030 |
Ramp archetype library, DSCR sensitivity bands to queue delay and utilization bands |
Drag Impact Table
|
Drag |
Directional impact on economics |
Where it shows up |
Who it impacts most |
Timeframe |
How we measure it in the pack |
|
Grid connection queues and reinforcement timing |
High impact on schedule and covenant timing because delays shift cashflow and trigger LDs |
Commissioning slips, staged energization, re-sequenced build plans |
Banks, EPCs, developers |
2025–2030 |
Queue and reinforcement signal mapping, delay bands in months, covenant timing stress logic |
|
Permitting complexity for integrated hubs and industrial siting |
Medium to High impact on FID conversion because approvals are multi-layered |
Longer lead times, scope changes, litigation exposure in sensitive areas |
IC teams, developers |
2025–2029 |
Permit pathway mapping, friction scorecards, “permit-to-build” stage gating framework |
|
Offtaker willingness-to-pay capped by industrial substitution economics |
High impact on revenue because offtake prices face ceilings and renegotiation risk |
Conditional contracts, price caps, volume-light commitments |
Developers, IC teams |
2025–2030 |
Offtaker archetype economics bands, price-cap prevalence, renegotiation trigger mapping |
|
Electrolyser performance under flexible operations and cycling |
Medium impact on opex and availability because degradation and maintenance risk rises |
Lower effective utilization, stricter operating windows, higher service intensity |
Operators, OEMs, banks |
2026–2030 |
Performance risk bands, availability assumptions library, cycling sensitivity and warranty boundary mapping |
|
Compliance and audit burden increases transaction cost and delay |
Medium impact on execution because evidence and certification add friction |
Slower contracting, higher legal and verification effort |
Developers, corporates |
2025–2030 |
Auditability workload mapping, documentation requirements matrix, compliance failure modes register |
Opportunity Zones & White Space
-
Contract-first projects in industrial clusters remain underpriced when teams can translate operational need into enforceable volume floors, because the market is moving toward bankable offtake and it shows up in faster FID conversion and stronger covenant comfort relative to projects built on merchant optimism.
-
Hybrid power sourcing and curtailment-aware operating strategies create advantage where delivered cost is otherwise volatile, because the market punishes flat-price assumptions and it shows up in fewer renegotiations and more resilient utilization bands during power market stress.
-
Mid-scale offtake aggregation is emerging as a practical bridge between fragmented demand and bankability, because single buyers often resist long-term commitments and it shows up in platforms and structured intermediaries that can standardize terms, credit support, and compliance evidence.
-
Hub infrastructure plays can outperform pure hydrogen sales when developers monetize shared permitting, grid strategy, and logistics optionality, because interface risk is the silent killer and it shows up in projects that keep schedules intact even when individual offtakes wobble.
-
Retrofit and integration services around industrial process interfaces are a quiet value pool, because the hardest work is on the customer side of the fence and it shows up in faster adoption for users who cannot disrupt operations to adopt hydrogen.
-
Compliance-grade traceability and evidence tooling has white space in practice, because auditability is becoming a contract condition and it shows up as lower transaction friction for projects that can prove origin and additionality without custom legal scaffolding each time.
Market Snapshot: By
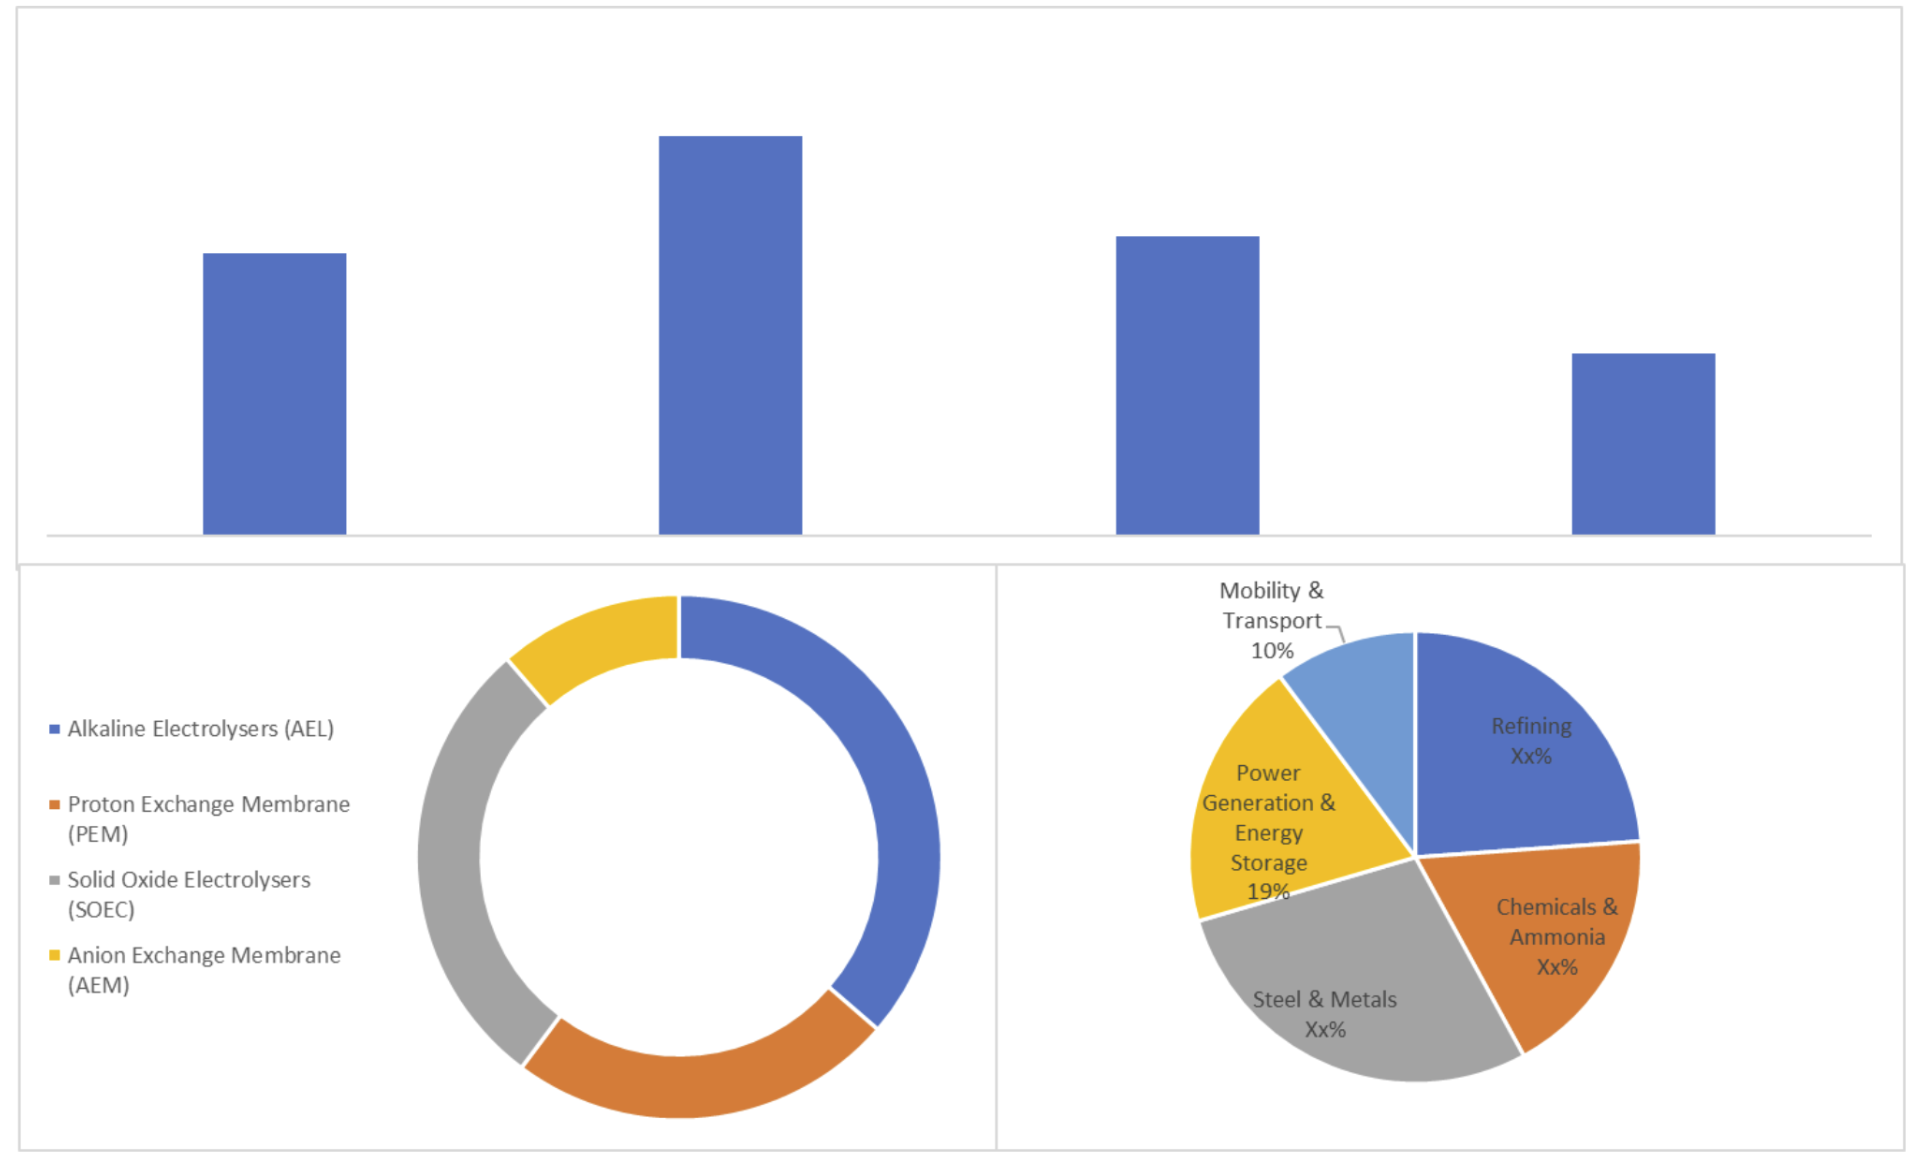
Source: Proprietary Research & Analysis
Mini Case Pattern
Pattern: From diligence to cashflow, where this market surprises teams
A hub-style project combines grid-connected electrolysis with a renewable sourcing strategy and targets an industrial offtaker portfolio across a regional cluster. Diligence assumed that electrolyser capex decline and policy support would drive bankability once permits were in place, and that offtakers would sign once “green supply” was credible. In execution, grid connection sequencing slipped and the compliance evidence burden for renewable origin tightened, which pushed commissioning into a phased ramp that did not match the original covenant calendar. The friction point was the permits-to-offtake gap, where permits existed but enforceable volumes lagged because auditability and delivered cost stability were not fully solved.
For the IC, the implication is underwriting utilization via contract gates rather than nameplate.
For the bank, the implication is DSCR comfort depends first on offtake enforceability and ramp realism.
For the operator, the implication is availability risk rises when flexible operations are assumed but not designed for.
Competitive Reality
Share is shifting toward teams that can convert complexity into a financing narrative. The mechanism is that offtake certainty, compliance proof, and grid strategy now determine time-to-cashflow more than stack procurement, and it shows up as fewer winners taking larger slices of bankable volume while many “pipeline leaders” remain stuck in pre-FID loops. Incumbent utilities and integrated developers tend to gain when they control power sourcing and grid interfaces, while pure-play project sponsors lose relevance if they cannot carry compliance and contracting complexity.
OEMs and EPC aggregators quietly win when they design around commissioning and performance boundaries for flexible operations, because investors are starting to price availability and degradation under cycling into covenant risk, and this shows up in more conservative guarantees, tighter scope definitions, and preference for partners who can manage balance-of-plant and integration risk rather than only stack delivery.
Strategy pattern table
|
Winning play |
Who uses it (archetype) |
Why it works |
Where it fails |
What signal to watch |
|
Contract-led development with staged build |
Integrated developer with strong legal and commercial bench |
Bankability improves when volume floors and compliance proof are baked into contracts |
Fails when offtake remains conditional or when power sourcing is not secured |
Contract conversion rate from LOIs to enforceable terms |
|
Hub integration with shared infrastructure |
Cluster developer and infrastructure-led sponsor |
Reduces interface risk and speeds repeatability across projects |
Fails when shared dependencies become single points of delay |
Permit sequencing clarity and grid reinforcement timing confidence |
|
Power procurement engineered as a shape hedge |
Developer-operator with power market capability |
Stabilizes delivered cost under volatility and curtailment realities |
Fails when procurement strategy relies on fragile assumptions or counterparties |
Evidence of structured sourcing and curtailment-aware operations |
|
Compliance-first traceability and audit readiness |
Sponsor with governance and evidence tooling |
Lowers transaction friction and increases offtaker confidence |
Fails when rules change faster than documentation systems adapt |
Auditability burden trends and contract clauses on compliance |
|
Customer-side integration services |
EPC-operator hybrid focused on industrial interfaces |
Unlocks adoption by reducing process disruption and operational risk for offtakers |
Fails when customer economics do not support switching |
Customer retrofit pipeline quality and repeatable integration templates |
Recent M&A Deals:
-
Thyssenkrupp nucera acquires core technology assets from Green Hydrogen Systems. It strengthened its electrolyser portfolio by acquiring key PEM technology and IP from GHS, expanding its alkaline-to-PEM offering for large-scale industrial green hydrogen projects.
-
Power2X acquired HyCC to accelerate development of large-scale green hydrogen and e-molecules projects in Amsterdam, Delfzijl, and Rotterdam, securing strong industrial offtake pipelines.
-
Masdar took a significant minority stake in OMV’s flagship project, gaining access to long-term industrial offtake in refining and chemicals while expanding its European green hydrogen footprint.
-
Air Liquide acquired control of H2V’s portfolio of electrolyser projects and offtake contracts, consolidating its position in industrial-scale green hydrogen production and distribution.
-
Linde completed the purchase of Air Products’ merchant hydrogen business across multiple EU countries, including electrolyser-linked supply chains and offtake agreements for industrial users.
Recent Private Deals:
-
Eurazeo leads €192 million equity round in terralayr, Eurazeo backed terralayr’s electrolyser platform and green hydrogen production business, targeting industrial offtake and grid-scale flexibility.
-
Carlyle and Mubadala-backed Moeve approves €1 billion green hydrogen facility, Moeve greenlit one of Southern Europe’s largest green hydrogen projects with secured industrial offtake, backed by private equity capital.
-
EQT’s €21.5 billion fund committed significant capital to electrolyser projects and offtake-driven green hydrogen initiatives across the Nordics and Germany.
-
Ares Management €2 billion (20%) stake in Eni Plenitude, which includes large-scale green hydrogen production and industrial offtake agreements.
-
KKR €3.6 billion follow-on investment in Enilive, this supported Eni’s low-carbon hydrogen and e-fuels business, focusing on electrolyser deployment and secured industrial offtake contracts.
Key Developments:
-
Low-Carbon Hydrogen Delegated Act finalized, the Commission defined clear GHG savings thresholds (≥70%) for low-carbon hydrogen, enabling blue and non-RFNBO electrolytic pathways and unlocking offtake contracts for industrial users (steel, chemicals, refining).
-
EU Hydrogen Mechanism launched, the new matching platform on the Energy Platform facilitated >260 supply offers in Phase 1 and moved to buyer consultations, significantly improving visibility and security for green hydrogen offtake agreements.
-
Innovation Fund auctions, the auction awarded €992 million to 15 renewable hydrogen projects.
-
IPCEI Hy2Move approved with €1.4 billion public funding, the Project of Common European Interest unlocked an additional €3.3 billion in private investment for 13 hydrogen projects focused on electrolysers and industrial offtake.
-
Clean Industrial Deal & State Aid Framework, New rules enable targeted public support for green hydrogen in hard-to-abate sectors until 2030, combined with the Net-Zero Industry Act, boosting electrolyser manufacturing and long-term offtake commitments.
Capital & Policy Signals
Capital is not retreating from EU green hydrogen, but it is getting sharper about where risk is real. The mechanism is that lenders and ICs increasingly treat grid connection, compliance auditability, and offtake enforceability as first-order drivers, the direction is more conditional commitments and staged financings, and it shows up in wider spreads between “announced” and “financeable” projects and a preference for hubs with credible conversion gates. Policy narratives can look uniformly supportive, but funding patterns often favor projects that can survive compliance scrutiny and delivered cost volatility, which should change how teams interpret headlines.
Policy shifts matter less in their ambition and more in their enforceability. Where rules clarify eligibility and audit requirements, contracting accelerates; where ambiguity persists, offtake stays conditional and projects stall in pre-FID. IC teams should discount promotional capacity announcements and overweight the signals that show contract conversion, queue progression, and covenant-ready ramp profiles.
Decision Boxes
IC/Investor Decision Box: Underwriting thresholds that actually move IC memos
When permitting and compliance evidence cannot be mapped into a realistic contracting timeline, utilization assumptions drift upward and downside is mispriced. This shows up as model IRRs that depend on early ramp rather than bankable volume floors, so the decision is to underwrite staged conversion gates and treat offtake enforceability as the primary value driver.
Bank Decision Box: What changes DSCR and covenant comfort first
When grid connection timing and ramp profiles are uncertain, cashflow timing risk dominates and DSCR headroom erodes even with attractive capex narratives. This shows up in covenant stress around commissioning and early operating years, so the decision is to prioritize enforceable offtake terms, conservative ramp bands, and explicit mitigation for queue delay.
OEM Decision Box: Where specs, retrofits, and compliance budgets really shift
When projects move toward flexible operations to match renewable supply shape, degradation and availability risks become financing variables rather than engineering details. This shows up in tighter warranty boundaries, conservative performance guarantees, and higher service intensity, so the decision is to align specs and retrofit packages to cycling reality and compliance-driven operating constraints.
EPC Decision Box: Where delivery risk hides (scope, LDs, commissioning, availability)
When integration complexity sits in balance-of-plant, utilities interfaces, and customer-side tie-ins, schedule and LD risk is underappreciated. This shows up in commissioning delays and scope disputes that compress margins, so the decision is to tighten interface definitions, stage commissioning plans, and price LD exposure against realistic energization and ramp pathways.
Operator Decision Box: What breaks in O&M and how it hits availability and opex
When operating profiles swing with renewable availability and offtake variability, maintenance cycles and performance stability are stressed. This shows up in availability volatility and higher opex sensitivity to cycling, so the decision is to run O&M planning off constraint-driven utilization bands and to monitor degradation and downtime triggers as financial risk inputs.
Methodology Summary
This pack builds forecasts by treating EU green hydrogen as a conversion problem from development intent to contracted cashflows, rather than as a nameplate capacity build curve. We segment the market by project archetype, operating profile, and offtake structure, then apply stage-gated conversion logic that explicitly models permitting, grid connection progression, compliance eligibility, and contract bankability. Assumptions are validated by triangulating public policy frameworks, disclosed project pipelines, grid and permitting signals where relevant, and market disclosures from stakeholders, with risk adjustments applied through banded sensitivities on utilization, ramp timing, and revenue certainty rather than point estimates.
The methodology reduces forecast error by making the hard-to-fake constraints explicit, especially the permits-to-offtake gap, and by separating “possible capacity” from “financeable volume.” Limitations are treated as variables with scenario bands and decision thresholds, so IC teams can stress-test outcomes without being forced into false precision.
Analyst credibility box
We work by turning public signals into underwriting variables that IC teams can actually use, then stress-testing those variables with banded sensitivities and stage gates. In this market, the hardest data to verify consistently is not electrolyser announcements, but the audit-ready compliance pathway and the enforceability of offtake volumes through commissioning and ramp.
Limitations box
-
Policy interpretations can tighten in implementation, so compliance eligibility is handled as scenario bands with explicit failure modes.
-
Grid queue visibility and reinforcement timelines vary by jurisdiction, so connection risk is modelled as timing bands rather than a single date.
-
Offtaker willingness-to-pay is sensitive to their substitution economics, so revenue certainty is stress-tested via price-cap and volume-floor archetypes.
-
Merchant upside is treated as optionality, not base case, unless contract structure makes it financeable.
What changed since last update
-
Greater emphasis on auditability and compliance proof in bankability screens.
-
More staged ramp assumptions due to grid and permitting sequencing realities.
-
Contract structures increasingly reflect delivered cost stability and renegotiation triggers.
Source Map
-
European Commission policy frameworks and delegated acts relevant to renewable fuels and origin criteria
-
National energy regulators and permitting authorities (where accessible and relevant)
-
Grid operators and connection process disclosures (TSO/DSO level)
-
Public auction and support scheme outcomes where applicable
-
Project pipeline disclosures from developers and public registries
-
Bank and lender commentary on covenant and project finance structuring (public)
-
OEM disclosures on performance, warranties, and service frameworks (public)
-
Industrial offtaker decarbonization plans and procurement disclosures (public)
-
Port, hub, and industrial cluster development plans (public)
-
Market operator power price and curtailment signals (public)
-
Standards and certification bodies relevant to guarantees of origin and auditability (public)
-
Trade associations and stakeholder consultation responses (public)
Why This Reality Pack Exists
Generic syndicated reports often treat this market as a linear deployment story, which is exactly how teams end up underwriting the wrong risks. EU green hydrogen is a market where the biggest errors come from pretending that capacity equals contracted volume and that policy ambition equals bankable cashflows. This Reality Pack exists to correct the blind spots that hit IC memos and credit committees first: utilization realism, grid and permitting sequencing, compliance auditability, and the actual enforceability of offtake. For a €2000 decision pack, the value is not a prettier forecast curve, it is tighter downside control and fewer false positives in the pipeline.
What You Get
-
80–100 slide PDF built like IC-ready slides, designed to drop into investment committee packs and lender discussions.
-
Excel Data Pack
-
20-minute analyst Q&A to pressure-test your assumptions, clarify scope boundaries, and align the pack to your diligence questions.
-
12-month major-policy mini-update to keep the core compliance and bankability assumptions current.
Snapshot: EU Green Hydrogen (Electrolyser + Offtake) Market 2025–2030
The installed base remains modest relative to headline announcements, and the trajectory is defined less by stack availability and more by contract conversion, because the permits-to-offtake gap pushes projects into phased ramps that show up in utilization dispersion across hubs and archetypes, which forces IC and bank teams to underwrite staged cashflows rather than straight-line capacity ramps. Demand patterns are increasingly anchored in industrial substitution logic rather than pure decarbonization intent, and this shows up in offtake terms that include caps, conditions, and renegotiation triggers, which makes enforceability and counterparty quality the real risk band drivers. Policy levers matter most where they reduce auditability ambiguity and stabilize eligibility, and this shows up as faster contracting in jurisdictions and schemes with clearer compliance evidence pathways, which shifts the next five years into a contest of who can prove and contract compliant molecules, not who can announce the largest plant.
Sample: What the IC-Ready Slides Look Like
-
A one-page IC decision summary that ranks bankability drivers by enforceability and timing risk, not by headline capacity.
-
A consensus vs reality chart that separates announced electrolyser MW from financeable contracted volume bands.
-
A risk and mitigants layout that maps permitting, grid, compliance, and offtake into covenant timing exposure.
-
An opportunity map that highlights where hub integration reduces interface risk and accelerates conversion.
-
A deal-screen criteria slide that turns offtake terms and power sourcing shape into underwriting thresholds.
-
A sensitivity table that stresses DSCR against queue delay bands, utilization bands, and offtake price-cap behavior.
-
A pipeline heat snippet that focuses on conversion gates and constraint signals, not just project counts.
Why Purchase This Report?
IC-Defensible Thesis, Not “Market Size”
A decision frame you can take into committee: boundary, base case, and what would change our view.
Evidence Ladder You Can Audit
Artefacts-led (grid offers, tenders, term-sheet structures, warranty language), mapped to what each proves and where it fails.
IRR Kill-Shots and Early Signals
The repeatable ways projects miss IRR (timeline, capex, availability, settlement): plus the first signals that show up before the slide.
Regime Classes and Dominant Variables
Why identical assets underperform in different environments: the one variable that dominates returns by regime (payer, settlement, constraints, curtailment logic.
Table of Contents
EU Green Hydrogen (Electrolyser + Offtake) Market 2026–2030
1. Executive Brief/Summary (What Everyone’s Missing)
1.1 Market Size & Forecast (2026–2030)
1.2 Where Most Forecasts Go Wrong and Where the Money’s Actually Going
1.3 High-Level Opportunity Snapshot
2. Research Architecture & Field Intelligence
2.1 Research Methodology & Data Sources
2.2 Top 3 Growth Signals from Market Stakeholders
2.3 Execution Friction: Where Projects Fail in Reality
3. Demand Outlook
3.1 Key demand drivers, focused on what changes decisions
3.2 Underserved Buyer Segments & Use Cases
3.3 Procurement and Pricing Patterns
4. Opportunity and White Space Map
4.1 Two Priority Segments to Watch
4.2.Regions / verticals with high pain, low competition
4.3. Integration Gaps and Pricing Bands that still work
4.4. Top Risks & Practical de-risk Levers
5. Competitive Intelligence: Strategic Benchmarking
5.1 Market Share Breakdown: Key Players (2024/25E)
5.2 Who’s Gaining Share, and Why (Talent, M&A, Policy Edge)
5.3 Challenger Playbook: How Smaller Players Are Quietly Winning
5.4. Company Profiles
5.4.1. Company 1
5.4.2. Company 2
5.4.3. Company 3
5.4.4. Company 4
5.4.5. Company 5
5.5. Capital flows:
5.5.1. By Investor Type (VC, PE, Infra, Strategics)
5.5.2. Investment Patterns, M&A, JV, and Expansion Moves
6. Market Segmentation
6.1 By Electrolyser Technology
6.1.1 Alkaline Electrolysers (AEL)
6.1.2 Proton Exchange Membrane (PEM)
6.1.3 Solid Oxide Electrolysers (SOEC)
6.1.4 Anion Exchange Membrane (AEM)
6.1.5 Others
6.2 By Project Capacity Scale
6.2.1 Small-Scale (<10 MW)
6.2.2 Medium-Scale (10–100 MW)
6.2.3 Large-Scale (100–500 MW)
6.2.4 Gigawatt-Scale (>500 MW)
6.2.5 Others
6.3 By Offtaker Industry
6.3.1 Refining
6.3.2 Chemicals & Ammonia
6.3.3 Steel & Metals
6.3.4 Power Generation & Energy Storage
6.3.5 Mobility & Transport
6.3.6 Others
6.4 By Offtake Contract Structure
6.4.1 Long-Term Fixed Price Contracts
6.4.2 Index-Linked / Variable Price Contracts
6.4.3 Merchant / Spot Sales
6.4.4 Hybrid (Contract + Merchant)
6.4.5 Others
6.5 By Geography
6.5.1 Germany
6.5.2 Spain
6.5.3 France
6.5.4 Netherlands
6.5.5 Rest of Europe
7. Action Frameworks for 2025–2028
7.1 Market Entry Options by Archetype (Builders, Tech Entrants, Investors)
7.2 Three realistic GTM Patterns
7.3 Strategic Watchlist: What to Monitor Quarterly
8. IC-Ready Decision Pack (Slides You Can Reuse Directly)
8.1. One-page IC Summary (yes/no, where, how)
8.2. 4-5 IC slides you can re-use (market thesis, risk & mitigants, competition)
8.2. Cheat sheets
8.4 Country / Segment Prioritization Slide
8.5 “Go / No-Go” Checklist for 2025–2028
Appendix: Reference Frameworks & Background:
-
A1. Regulatory overview (high-level, with links to primary docs)
-
A2. PESTLE snapshot
-
A3. Porters (one slide max, if at all)
-
A4. Supply chain maps
-
A5. Price band tables
Research Methodology
No research methodology information available for this report.
Frequently Asked Questions
Research Grounded in Verifiable Inputs
Our research draws on publicly verifiable inputs including regulatory filings, grid operator data, project announcements, and policy documents across Europe.
These inputs are cross-checked through structured discussions with industry participants to validate what is progressing in practice versus what remains theoretical.
Analyst-Led Research Support
Each report is supported by analysts who focus on specific energy domains and regions. Clients can discuss assumptions, clarify findings, and explore implications with analysts who follow these markets on an ongoing basis
Energy Insights,
Straight to Your Inbox
For People Who Sign Off on Energy Decisions.
Short updates on EU power, grids, storage, and execution risk. No spam, just what matters.
Unsubscribe anytime. No spam, ever.