EU Distribution Grid Reinforcement EPC Market 2026–2030: Queue-Driven Capex, Procurement Rewrites, and Where Delivery Risk Actually Prices Returns
Report Description
In the EU Distribution Grid Reinforcement EPC Market, the visible headline is “more capex,” but the investable reality is that grid connection queues and constrained outage windows are forcing DSOs to prioritize projects that can be delivered cleanly and commissioned predictably, which quietly penalizes EPC models built on change orders and subcontractor fragmentation. Where this shows up is in tender language that hard-codes compliance evidence, protection settings, SCADA integration, and as-built documentation, pushing risk into the EPC scope and tu
ing weak interface control into time slippage that ultimately delays customer connections and undermines network performance targets.
If you only change one assumption in your model, change: treat delivery certainty as the binding constraint, not total reinforcement capex, because queue release depends on commissioning readiness, outage access, and compliance closure more than it depends on budget headlines.
Key Insights
- 1Queue pressure makes commissioning readiness the real scarcity, so EPC models that control acceptance gates convert backlog into energized revenue faster.
- 2Procurement reform is shrinking the effective market for fragmented bidders, so framework access becomes a strategic asset that changes win probability more than bid price tweaks.
- 3Outage feasibility is being priced into tenders more explicitly, so delivery systems that plan phasing and cutovers avoid the schedule slippage that destroys margin.
- 4Standards tightening at the protection and data handover interface shifts value toward compliance closure, so documentation capability becomes a throughput constraint, not admin overhead.
- 5Labor authorizations and jointer capacity limit volume even when budgets rise, so scalable delivery depends on workforce structure more than on demand visibility.
- 6Long-lead equipment criticality turns procurement into critical path, so EPCs that can manage substitutions and sequencing avoid acceptance delays that look like “grid problems” to outsiders.
- 7Interface failures cause energization delays even after physical completion, so controlling civils-electrical-controls handoffs becomes a bankability variable, not just an execution detail.
- 8Cash conversion is increasingly tied to acceptance milestones, so DSCR comfort is moved first by milestone design and dispute propensity rather than by nominal contract size.
- 9Regional differences matter most in procurement and standards strictness, so geographic strategy should follow regime signals, not only demand headlines.
- 10The market is mispriced when teams underwrite steel and civils but ignore outage windows and compliance closure, which is why the queue-to-commissioning gap decides who wins.
Scope:
-
Last updated: February 2026
-
Data cut-off: January 2026
-
Coverage geography: EU-27 + UK
-
Base Year: 2025
-
Forecast period: 2026–2030
-
Delivery format + delivery time: PDF + Excel, delivered in 3–5 working days
-
Update policy: 12-month major-policy mini-update
-
Analyst access (Q&A): 20-minute analyst Q&A call
Why do forecasts go wrong in the EU Distribution Grid Reinforcement EPC Market?
Forecasts often extrapolate announced DSO investment plans into EPC revenue without modelling the conversion friction between “planned spend” and “commissioned assets.” The mechanism is queue pressure meeting delivery bottlenecks; the direction is that budgets can rise while executed volume lags; it shows up in re-tendering, delayed awards, and scope re-baselining when outage windows, permitting, and standards evidence are not ready. Many models also underweight procurement reform, where DSOs shift toward framework agreements, performance-linked acceptance, and tighter compliance packs, which changes who can bid and how margins behave. Decision implication: underwriting should be anchored to deliverability signals, not to plan announcements.
Where do projects fail in reality in grid reinforcement EPC?
Projects rarely fail on “engineering intent”; they fail at interfaces. The mechanism is fragmented scope across civil works, cable routes, protection settings, commissioning, and data handover; the direction is rework and schedule slip; it shows up as failed inspections, delayed energizations, and incomplete as-built documentation that blocks acceptance. A second friction point is outage access and traffic management constraints, where the build is technically straightforward but the network cannot be taken out of service when assumed. A third is standards drift across DSOs and regions, forcing redesign late in the cycle. Decision implication: execution diligence must test interface ownership, outage strategy, and compliance closure capacity.
How an IC team screens this market
-
Test whether revenue is anchored to commissioned outputs, not just awarded scopes.
-
Stress outage windows and access constraints as a primary schedule driver.
-
Underwrite standards compliance burden and documentation closure as a capacity constraint.
-
Check subcontractor density and interface control across civils, HV/LV, protection, SCADA.
-
Rate procurement route exposure, frameworks versus spot tenders, and penalty regimes.
-
Treat permitting and route constraints as schedule risk, not as a legal footnote.
-
Validate counterparty behavior, DSO payment terms, variation discipline, and claims culture.
Market Dynamics
The demand pattern that matters is not “more reinforcement” in the abstract, but which projects are pulled forward because they unlock constrained connections, such as feeder upgrades, secondary substations, cable replacements, and protection modernization that remove local bottlenecks rather than expand theoretical capacity. As queues harden, DSOs bias toward packages that fit outage realities and can pass compliance checks quickly, which shifts opportunity toward EPC teams that can design-for-constructability and manage commissioning evidence in parallel with build.
On the supply side, the market is separating into two behaviors: EPCs that treat reinforcement as a repeatable operating system with standard work packs, digital as-builts, and disciplined subcontracting, and EPCs that treat it as a project-by-project civil-and-cable job where margin is recovered through variations. That distinction is now priced directly by DSOs via prequalification, framework access, and acceptance regimes, and it shows up in who gets multi-lot awards versus who stays trapped in low-quality tenders.
Policy and regulation shape economics indirectly here by forcing acceleration while tightening standards, so schedule risk becomes a financial variable for bidders and their backers. Geographic “pockets” are best read as procurement and standards pockets, not just countries, because the same physical work can carry very different evidence burdens and outage feasibility assumptions across DSO regimes. The recurring investor misread is overestimating how fast plan-to-build converts, and underestimating how quickly procurement reform can lock weaker delivery models out of the addressable work.
Driver Impact Table
|
Driver that moves economics |
Directional impact (band) |
Where it shows up in EU-27 + UK |
Who it impacts most |
How we measure it in the pack |
|
Connection queue pressure prioritizes reinforcement that unlocks constrained nodes |
High impact on award volume and schedule criticality |
Tender calendars skew toward bottleneck feeders and substations tied to connection release |
EPC platforms, banks underwriting pipeline conversion |
Queue-release linkage index using public queue signals and DSO reinforcement priority cues (ranked) |
|
DSO procurement shift toward frameworks and performance-linked acceptance |
High impact on win rates and margin structure |
Framework access becomes the real market, spot tenders become residual |
EPC aggregators, OEM-linked installers |
Procurement-route map with framework prevalence bands and acceptance regime strictness scoring |
|
Standards tightening on protection, cybersecurity, and data handover |
Medium to high impact on scope and delivery friction |
More front-loaded engineering and compliance evidence, fewer “build first, document later” wins |
EPCs, OEMs supplying switchgear, controls integrators |
Compliance burden index using tender clauses, documentation lists, and acceptance milestones (ranked) |
|
Outage and access constraints push work into complex phasing |
Medium impact on schedule and LD exposure |
Night works, constrained outages, multi-stage cutovers become normal |
EPCs with high LD exposure, operators |
Outage feasibility screen using work type, typical outage windows, and commissioning dependency scoring |
|
Electrification-led load growth forces reinforcement of LV/MV assets |
Medium impact on sustained workload stability |
Cable replacements, secondary substations, feeder upgrades recur across DSOs |
EPCs, civils-heavy contractors |
Asset pressure proxy using DSO reliability targets, asset age signals, and reinforcement program indicators (ranked) |
Drag Impact Table (sample, banded sensitivity)
|
Drag that breaks models |
Directional impact (band) |
Where it shows up in EU-27 + UK |
Who it hurts most |
How we measure it in the pack |
|
Skilled labor and authorized jointer shortages cap deliverable volume |
High impact on throughput and commissioning |
Schedule slip and subcontractor premiums, especially in cable-heavy scopes |
EPCs without captive labor, banks relying on schedules |
Labor tightness proxy using subcontract density, lead-time bands, and delivery bottleneck mapping |
|
Permitting and route constraints stall civils and cable corridors |
Medium to high impact on start dates |
Wayleaves, municipal constraints, and corridor approvals delay mobilization |
EPCs with heavy civils exposure, operators |
Permitability screen by work type with friction bands and typical blocker catalogue |
|
Interface failures across civils, electrical, protection, and SCADA |
High impact on rework and acceptance |
Failed inspections, delayed energization, incomplete as-builts |
EPCs with fragmented subcontracting |
Interface complexity score using scope fragmentation, dependency count, and evidence closure checkpoints |
|
Supply lead times for switchgear, transformers, and protection equipment |
Medium impact on critical path |
Long-lead items dictate sequencing and cutover planning |
EPCs carrying procurement risk, OEM delivery chains |
Long-lead criticality map with rank-order by equipment class and substitution constraints |
|
Claims and variation disputes slow cash conversion |
Medium impact on working capital and DSCR comfort |
Payment timing drifts, acceptance milestones become cash gates |
Banks, EPCs with thin balance sheets |
Cash conversion stress test using milestone structures and dispute propensity bands |
Opportunity Zones & White Space
-
Commissioning-led EPC models are gaining pricing power because DSOs increasingly value evidence closure and energization predictability, and that preference shows up in acceptance regimes that reward disciplined testing, protection settings, and data handover readiness, which changes the bid calculus for EPCs who can own the last mile.
-
MV cable and substation packages tied to queue release remain structurally attractive when they sit at high-congestion nodes, because DSOs pull these forward to unlock connections, and it shows up in accelerated tendering and tighter deadlines that favor EPCs with repeatable work packs and outage planning depth.
-
Retrofit-heavy reinforcement creates a quiet niche for outage-optimized delivery since working inside live networks forces phasing, temporary supplies, and complex cutovers, which shows up as schedule risk that many bidders misprice, creating headroom for teams that can plan outages and commissioning as a single system.
-
Compliance-heavy scopes create whitespace for EPCs with standardized documentation and digital as-builts because DSOs are increasingly treating documentation as part of asset integrity, and it shows up in acceptance gating that smaller contractors struggle to meet, reducing effective competition in those lots.
-
Integrator gaps around protection and SCADA are becoming deal-relevant because reinforcement is increasingly software-adjacent at the interface, and it shows up when electrical completion is achieved but energization is delayed by data and settings closure, which creates a differentiated role for EPCs that can integrate controls without handoffs.
Market Snapshot – By Voltage level, Contract delivery & Reinforcement
Source: Proprietary Research & Analysis
Mini Case Pattern
Pattern: From diligence to cashflow, where this market surprises teams
A DSO-led MV feeder reinforcement package with cable replacement, a secondary substation upgrade, and protection scheme updates looks straightforward in diligence because the civil scope is familiar and the unit rates benchmark well. Execution surprises begin when the outage plan proves infeasible within assumed windows and the cutover has to be re-phased, which cascades into repeated site remobilizations. The friction point is not procurement or engineering; it is acceptance readiness, where energization is blocked by incomplete protection settings validation and delayed SCADA data handover evidence. For the IC team, this shifts the base case from “awarded scope equals revenue” toward “commissioning gates equal revenue timing.” For the bank, covenant comfort moves first with milestone structure and acceptance gating. For the operator, the pain concentrates in availability risk and extended opex from prolonged temporary configurations.
Competitive Reality
Share is moving toward EPC archetypes that behave like delivery systems, not like collections of subcontractors. The mechanism is that DSOs are turning quality and acceptance into binding constraints, and the direction is that repeatable work packs, disciplined commissioning, and compliance closure are replacing low bids as the true differentiator; it shows up in who wins frameworks and who is invited into multi-lot awards. The archetype losing relevance is the bidder that prices civils and cables tightly but cannot control protection, SCADA, or documentation interfaces, because failures now delay energization and attract penalties or exclusion from future frameworks.
Capital and talent flow follow the same logic. Operators and investors quietly favor platforms that can standardize delivery across DSOs and scale labor authorizations, while fragmented regional players increasingly compete in residual tenders where risk is poorly paid.
Strategy pattern table
|
Winning play |
Who uses it (archetype) |
Why it works |
Where it fails |
What signal to watch |
|
Commissioning-first delivery model with integrated protection and SCADA |
EPC aggregator with in-house controls capability |
Acceptance gates are met faster, energization risk is reduced |
Fails if outage strategy is weak or access constraints are misread |
Tender clauses that increase evidence packs and acceptance milestones |
|
Framework-centric growth with standard work packs |
Multi-region EPC platform |
Predictable pipeline and learning curve benefits |
Fails where DSO regimes vary sharply and standardization breaks |
Framework award concentration and requalification tightening |
|
Captive labor and authorized jointer scale |
Cable-heavy EPC specialist |
Throughput is protected in labor-tight markets |
Fails if procurement of long-lead equipment is unmanaged |
Subcontractor density rising and lead times stretching |
|
Interface ownership across civils, electrical, and documentation |
Mid-to-large EPC with strong PMO |
Reduces rework and variation disputes |
Fails if price discipline is lost and overhead swells |
Change-order frequency and acceptance rework events |
|
Risk-priced bids with clear exclusions and milestone logic |
Experienced reinforcement bidder |
Avoids value destruction from mis-scoped risk |
Fails if procurement penalizes transparency and rewards low bids |
Bid acceptance moving toward performance-linked criteria |
Key M&A Deals:
-
E.ON completed several bolt-on deals to expand its DSO modernisation, digital substation, and distribution reinforcement EPC capacity, supporting €7B+ annual investment plans.
-
Balfour Beatty divested selected UK distribution network and reinforcement-related assets to infrastructure investor Equitix, enabling capital recycling while sharpening focus on core DSO EPC work.
-
DWS divested its NorthC platform (Netherlands, Germany, Switzerland), including high-voltage distribution connections and substation upgrades required for power-intensive loads.
-
The merger created Saipem7, significantly enhancing EPC capabilities for distribution grid tie-ins, underground cabling, and reinforcement projects across Europe.
-
Discussions to form RetailCo and IndustrialCo entities include consolidation of grid-adjacent distribution assets and reinforcement EPC exposure in Iberia.
Key Private Equity Deals:
-
Ares invested in Eni’s renewable and mobility platform, which includes significant DSO-level grid reinforcement, flexibility services, and distribution modernisation projects across Italy and Europe.
-
KKR backed Eni’s biofuels and mobility arm, targeting grid-adjacent distribution infrastructure, smart-grid upgrades, and flexibility retrofits for DSO networks.
-
Ardian took full ownership of Energia Group, strengthening its DSO services, distribution reinforcement, and smart-grid capabilities in Ireland and broader European markets.
-
CVC acquired majority ownership in Low Carbon, a renewables developer with major DSO tie-ins, substation upgrades, and distribution reinforcement projects.
-
EQT’s largest-ever infrastructure fund allocated substantial capital to DSO modernisation, digital substations, and distribution grid reinforcement projects across Nordics and Central Europe.
Key Developments:
-
EU Grids Package adopted - The European Commission finalised the package, shortening DSO permitting timelines to a maximum of 2 years, mandating anticipatory investments, and prioritising digital substations and flexibility integration — directly accelerating EPC tendering and execution.
-
Record DSO investment - Major utilities (E.ON, Enel, Iberdrola, RWE) published €7B+ annual distribution capex programmes, focusing on grid reinforcement, smart substations, and EV/data-center connection upgrades.
-
Introduction of National flexibility procurement rules - Following the Flexibility Package, multiple countries (Germany, Netherlands, Italy, Spain) began mandatory DSO flexibility assessments and tenders, requiring EPC contractors to integrate demand response and storage into reinforcement projects from 2026.
-
Smart-meter rollout reaches critical mass - Germany and several CEE countries achieved >70% smart-meter penetration in 2025, enabling real-time monitoring, dynamic tariffs, and faster DSO digital reinforcement planning.
-
EV & data-center driven reinforcement surge - Mandatory grid studies and reinforcement tenders for high-load sites (data centres and EV charging hubs) increased sharply in 2025, with DSOs awarding large EPC contracts for medium-voltage upgrades and substation expansions.
Capital & Policy Signals (Deal-Screen Useful)
Recent capital signals in this space are less about headline “grid investment” and more about whether delivery platforms can scale without breaking quality. Where equity interest concentrates, it tends to follow the ability to convert frameworks into commissioned volume, because DSOs increasingly treat acceptance evidence and outage feasibility as real constraints, and that shows up when backlog grows but energized output does not.
Policy signals matter most where they change the durability of reinforcement programs and the tolerance for delayed connections. The market’s public narrative often implies a smooth ramp, but funding patterns tend to reward delivery certainty and working-capital resilience, especially where milestone structures make cash conversion sensitive to acceptance gates. For IC teams, the practical risk to discount is short-term noise around announcements; the risk to overweigh is execution friction that slows conversion even in “funded” programs.
Decision Boxes
1. IC/Investor Decision Box: Underwriting thresholds that actually move IC memos
Mechanism is commissioning gates and outage feasibility shaping conversion from backlog to energized assets. Direction is that awarded scope can inflate while realized throughput lags. It shows up in re-tenders and delayed acceptance. Decision implication is to underwrite delivery system strength and cash conversion, not nominal pipeline.
2. Bank Decision Box: What changes DSCR and covenant comfort first
Mechanism is milestone structures tied to acceptance evidence and energization, not physical completion. Direction is cash timing becomes more variable under tighter DSO acceptance. It shows up in working-capital draw and dispute risk. Decision implication is to stress acceptance gating and payment terms before capex assumptions.
3. OEM Decision Box: Where specs, retrofits, and compliance budgets really shift
Mechanism is DSO standards tightening on protection, cybersecurity, and data handover. Direction is more spend migrates into compliance-ready configurations and retrofit kits. It shows up in tender specs that demand evidence packs and interoperability. Decision implication is to align product and support to acceptance regimes, not only to hardware supply.
4. EPC Decision Box: Where delivery risk hides (scope, LDs, commissioning, availability)
Mechanism is interface fragmentation across civils, electrical, protection, and documentation. Direction is rework and schedule slip become the dominant margin destroyers. It shows up at inspection failures and energization delays. Decision implication is to price interface ownership and outage strategy explicitly, and avoid under-scoped commissioning.
5. Operator Decision Box: What breaks in O&M and how it hits availability and opex
Mechanism is prolonged temporary configurations and repeated cutovers when outages are mis planned. Direction is higher operational disruption and reactive maintenance exposure. It shows up in availability volatility and increased site interventions. Decision implication is to demand phasing clarity and acceptance readiness to protect network performance and opex.
Methodology Summary
This Reality Pack forecasts the EU Distribution Grid Reinforcement EPC Market by modelling the conversion from DSO reinforcement intent to commissioned delivery, using a constraint-first approach that treats outage feasibility, standards compliance, and commissioning closure as binding variables rather than assuming spend translates cleanly into executed volume. We build segment logic around reinforcement work types that are native to distribution networks, then apply risk-adjustments that reflect procurement route, acceptance gating, labour constraints, and long-lead equipment criticality. Limitations are handled explicitly by using banded sensitivities, rank-order signals, and indices rather than point estimates when inputs are not verifiable at market level.
Analyst credibility box:
We work from publicly checkable system signals and procurement artefacts, translating them into IC-grade decision variables. The hardest data to verify consistently in this market is conversion timing from award to energization and the true drivers of acceptance delay, so the pack relies on constraint proxies and evidence-gated risk bands rather than unsupported precision.
Limitations box:
-
National and DSO procurement regimes differ, so cross-market comparability is handled via ranked strictness bands rather than assumed uniformity.
-
Queue data is not always standardized, so conversion signals are treated as directional and triangulated across multiple proxies.
-
Labor and equipment lead times move quickly, so the pack uses sensitivity bands and scenario stress tests.
-
EPC margins are often opaque, so risk pricing is inferred from tender structures and delivery friction indicators.
What changed since last update:
-
DSO acceptance regimes and documentation requirements are tightening in more tenders, shifting value toward commissioning-ready EPC models.
-
Framework and prequalification routes are becoming a larger share of addressable work, reducing the relevance of spot-tender optics.
-
Outage feasibility is showing up more explicitly as a planning and bid discriminant.
Source Map
-
DSO investment plans and regulatory determinations
-
National regulators and EU-level policy communications
-
Public tender portals and framework award notices
-
DSO technical standards for protection, commissioning, and data handover
-
Grid connection queue disclosures and connection process documentation
-
Equipment OEM disclosures on lead times and compliance requirements
-
Public network reliability and performance targets
-
Municipal permitting and wayleave guidance where available
-
EPC contract forms and acceptance milestone structures seen in procurement documents
-
Publicly disclosed infrastructure financing terms and covenant patterns (where disclosed)
-
Industry association briefings relevant to distribution networks
-
Cross-border technical coordination references where applicable
Why This Reality Pack Exists
Generic reports treat this market as a spend curve. Decision teams get hurt because the spend curve does not tell you what converts into commissioned assets, what fails at acceptance, or which EPC archetypes are structurally advantaged under tightening DSO regimes. This pack exists to put delivery friction and bankability variables into the center of the model, so IC teams stop underwriting plans and start underwriting conversion. At a €2000 price point, the logic is simple: you are buying fewer claims and more decision variables, expressed in a way that can survive an IC memo, a lender conversation, and an operator reality check.
What You Get
-
80–100 slide PDF designed as an IC-ready brief, with decision screens, risk bands, and market-native work type segmentation.
-
Excel Data Pack
-
20-minute analyst Q&A focused on underwriting assumptions, execution friction, and how to interpret the signals.
-
12-month major-policy mini-update capturing changes that alter revenue certainty, procurement access, and delivery constraints.
Snapshot: EU Distribution Grid Reinforcement EPC Market 2025–2030
Installed assets are already dense and ageing in parts of EU-27 + UK, and reinforcement is increasingly pulled forward by connection conversion pressure rather than by discretionary resilience spend, which is why EPC demand clusters around bottleneck relief work that can be commissioned quickly. The growth trajectory is best read through deliverability, because outage windows and acceptance regimes are tightening, and this shows up when awarded scopes accumulate but energized outputs lag, forcing DSOs to favor EPC models that can close documentation and commissioning evidence without rework. Policy levers matter most where they harden programs and procurement access, while the risk bands are dominated by labor scarcity, long-lead equipment criticality, and interface complexity, all of which translate into schedule risk that directly changes cash conversion and lender comfort. The next five years matter because procurement reform is effectively redrawing who can compete, and the winning edge is moving from unit-rate bids to disciplined delivery systems.
Sample: What the IC-Ready Slides Look Like
You should expect slides that feel like an IC memo, not a market brochure:
-
a one-page decision summary that frames underwriting variables around commissioning gates and cash conversion;
-
a consensus-versus-reality exhibit that contrasts plan announcements with deliverability constraints using index logic;
-
a risk-and-mitigants layout that treats outage feasibility, acceptance evidence, and interface control as primary risks;
-
an opportunity map that separates “framework-accessible, compliance-heavy” work from residual tenders;
-
a deal-screen page that turns procurement routes, LD exposure, and working-capital sensitivity into ranked filters;
-
a sensitivity table that stresses queue conversion delays, acceptance gating strictness, and long-lead criticality;
-
and a pipeline heat snippet that ties reinforcement prioritization to connection conversion pressure without publishing confidential project lists.
Why Purchase This Report?
IC-Defensible Thesis, Not “Market Size”
A decision frame you can take into committee: boundary, base case, and what would change our view.
Evidence Ladder You Can Audit
Artefacts-led (grid offers, tenders, term-sheet structures, warranty language), mapped to what each proves and where it fails.
IRR Kill-Shots and Early Signals
The repeatable ways projects miss IRR (timeline, capex, availability, settlement): plus the first signals that show up before the slide.
Regime Classes and Dominant Variables
Why identical assets underperform in different environments: the one variable that dominates returns by regime (payer, settlement, constraints, curtailment logic.
Table of Contents
EU Distribution Grid Reinforcement EPC Market
1. Executive Brief/Summary (What Everyone’s Missing)
1.1 Market Size & Forecast (2025–2030)
1.2 Where Most Forecasts Go Wrong and Where the Money’s Actually Going
1.3 High-Level Opportunity Snapshot
2. Research Architecture & Field Intelligence
2.1 Research Methodology & Data Sources
2.2 Top 3 Growth Signals from Market Stakeholders
2.3 Execution Friction: Where Projects Fail in Reality
3. Demand Outlook
3.1 Key demand drivers, focused on what changes decisions
3.2 Underserved Buyer Segments & Use Cases
3.3 Procurement and Pricing Patterns
4. Opportunity and White Space Map
4.1 Two Priority Segments to Watch
4.2.Regions / verticals with high pain, low competition
4.3. Integration Gaps and Pricing Bands that still work
4.4. Top Risks & Practical de-risk Levers
5. Competitive Intelligence: Strategic Benchmarking
5.1 Market Share Breakdown: Key Players (2024/25E)
5.2 Who’s Gaining Share, and Why (Talent, M&A, Policy Edge)
5.3 Challenger Playbook: How Smaller Players Are Quietly Winning
5.4. Company Profiles
5.4.1. Company 1
5.4.2. Company 2
5.4.3. Company 3
5.4.4. Company 4
5.4.5. Company 5
5.5. Capital flows:
5.5.1. By Investor Type (VC, PE, Infra, Strategics)
5.5.2. Investment Patterns, M&A, JV, and Expansion Moves
6. Market Segmentation
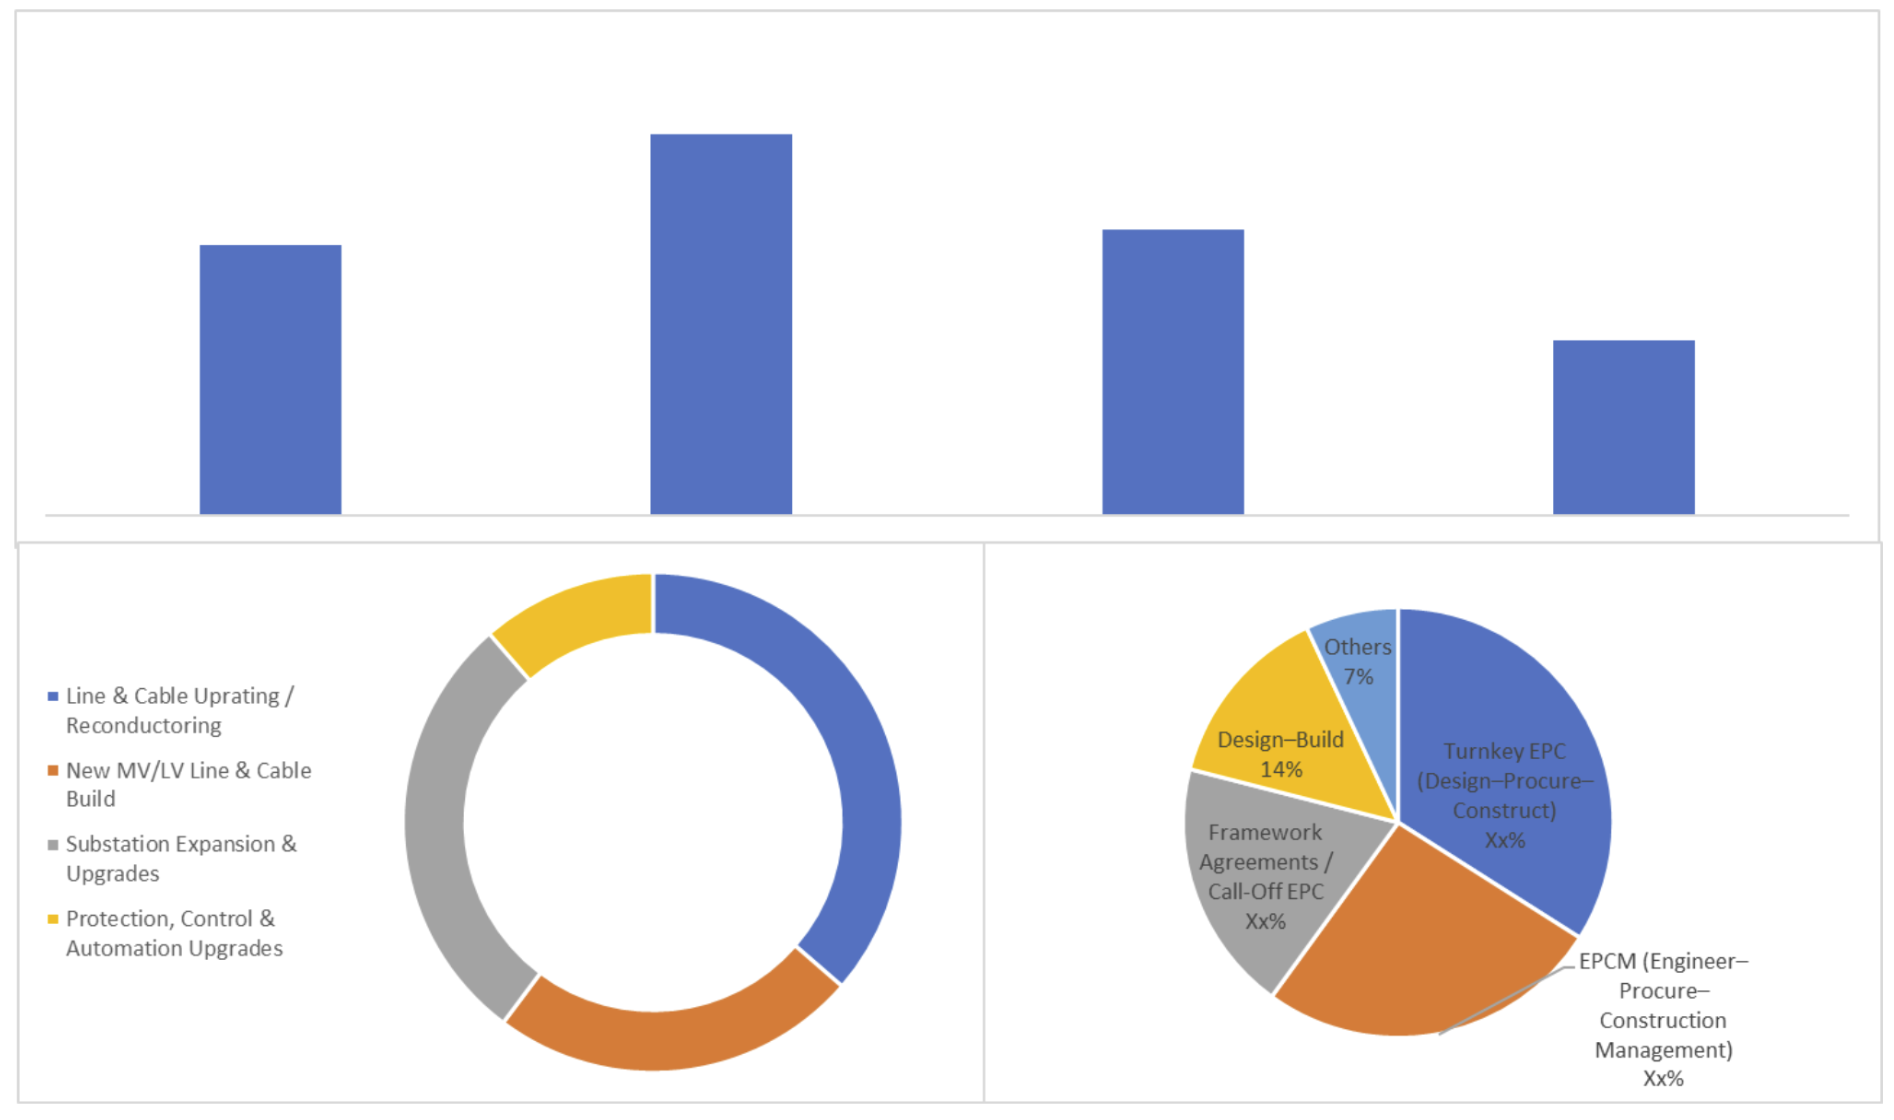
6.1 By Reinforcement Scope
6.1.1 Line & Cable Uprating / Reconductoring
6.1.2 New MV/LV Line & Cable Build
6.1.3 Substation Expansion & Upgrades
6.1.4 Protection, Control & Automation Upgrades
6.1.5 Others
6.2 By Voltage Level
6.2.1 Low Voltage (LV)
6.2.2 Medium Voltage (MV)
6.2.3 MV/LV Mixed Projects
6.2.4 Secondary Substation Level
6.2.5 Others
6.3 By Project Trigger
6.3.1 Renewable Integration (DER, rooftop PV, onshore wind)
6.3.2 EV Charging & Electrification Load Growth
6.3.3 Reliability & Resilience (hardening, outage reduction)
6.3.4 Regulatory Compliance & Standards Upgrades
6.3.5 Others
6.4 By Contract & Delivery Model
6.4.1 Turnkey EPC (Design–Procure–Construct)
6.4.2 EPCM (Engineer–Procure–Construction Management)
6.4.3 Framework Agreements / Call-Off EPC
6.4.4 Design–Build
6.4.5 Others
6.5 By Geography
6.5.1 Germany
6.5.2 France
6.5.3 United Kingdom
6.5.4 Italy
6.5.5 Spain
6.5.6 Rest of Europe
7. Action Frameworks for 2025–2028
7.1 Market Entry Options by Archetype (Builders, Tech Entrants, Investors)
7.2 Three realistic GTM Patterns
7.3 Strategic Watchlist: What to Monitor Quarterly
8. IC-Ready Decision Pack (Slides You Can Reuse Directly)
8.1. One-page IC Summary (yes/no, where, how)
8.2. 4-5 IC slides you can re-use (market thesis, risk & mitigants, competition)
8.2. Cheat sheets
8.4 Country / Segment Prioritization Slide
8.5 “Go / No-Go” Checklist for 2025–2028
Appendix: Reference Frameworks & Background:
-
A1. Regulatory overview (high-level, with links to primary docs)
-
A2. PESTLE snapshot
-
A3. Porters (one slide max, if at all)
-
A4. Supply chain maps
-
A5. Price band tables
Research Methodology
No research methodology information available for this report.
Frequently Asked Questions
Research Grounded in Verifiable Inputs
Our research draws on publicly verifiable inputs including regulatory filings, grid operator data, project announcements, and policy documents across Europe.
These inputs are cross-checked through structured discussions with industry participants to validate what is progressing in practice versus what remains theoretical.
Analyst-Led Research Support
Each report is supported by analysts who focus on specific energy domains and regions. Clients can discuss assumptions, clarify findings, and explore implications with analysts who follow these markets on an ongoing basis
Energy Insights,
Straight to Your Inbox
For People Who Sign Off on Energy Decisions.
Short updates on EU power, grids, storage, and execution risk. No spam, just what matters.
Unsubscribe anytime. No spam, ever.