EU C&I Behind-the-Meter BESS Market 2026–2030: Flexibility Monetization Versus Network Reality, and Why Multi-Site Winners Look Nothing Like Pipeline Leaders
Report Description
EU C&I Behind-the-Meter BESS Market 2026-2030 is moving from a procurement-led cycle to an underwriting-led one: teams are no longer asking “what size battery fits the site,” they are asking “which parts of the revenue stack are actually bankable under the local network and market rules.” The mechanism is simple: wholesale volatility and local grid constraints increase the theoretical value of flexibility, but DSOs, metering configurations, and dispatch permissions decide whether a C&I asset can express that flexibility when it matters. You see it in projects that look strong on spreadsheet arbitrage yet deliver thin realized capture once export limits, baseline rules, and aggregator constraints are applied. The decision implication is that the best assets are often the least visible ones, because value concentrates in portfolios that can be controlled, verified, and settled cleanly.
Mainstream forecasts tend to over-count addressable value by treating every site as if it can do the same things. In reality, the market splits into two different games: one where savings are dominated by network and peak management under site-specific tariff structures, and another where ea
ings depend on participation rules and aggregation quality. Capital is already shifting toward repeatable playbooks that can scale across sites, because operational verification and settlement are what tu
“flexibility” into revenue that survives audit and credit committees. Execution friction sits less in construction and more in grid-interface paperwork, metering design, and who owns the right to dispatch. If you only change one assumption in your model, change: assume revenue-stack eligibility is portfolio-specific and regulator-specific, not a generic market attribute.
Key Insights
- 1Dispatch value rises with volatility, but realized capture often compresses where DSOs restrict export and where sites cannot dispatch during operational peaks, so underwriting should privilege controllability over headline spreads.
- 2Revenue-stack eligibility is not a market constant; it varies by country, DSO, and metering setup, so portfolio outcomes depend on how well a team standardizes compliance and verification.
- 3Measurement governance is becoming a financing variable because stricter telemetry and baseline requirements reduce disputes, which shows up in more stable cashflows and stronger covenant comfort.
- 4Savings-led cases can be more durable than market-led cases when tariff structures penalize peaks, which is why some “boring” industrial and logistics sites underwrite better than more glamorous narratives.
- 5Aggregation creates access to flexibility value, but it also imports contract and settlement risk, which shows up in revenue leakage unless dispatch authority and override rules are locked.
- 6EPC risk increasingly hides in the grid-interface layer because connection terms and metering design can force redesign and delay revenue start, so diligence should treat DSO-interface scope as critical-path.
- 7Competitive winners are those who repeatedly convert site permissions and telemetry into settled payments, which shows up in low dispute rates and faster time to first settlement.
- 8Policy direction supports flexibility in principle, but implementation dispersion is the investable reality, which shows up in country clusters where addressability improves sooner than narratives imply.
Scope of the Study
Above-the-Fold Snapshot
-
What the market is: C&I behind-the-meter battery systems used to reshape site load, reduce network-related costs, and access flexibility revenues through aggregation where rules allow.
-
What is changing into 2030: Value is drifting from “battery as capex” to “battery as contract and operating system,” because tariffs, metering, and dispatch permissions decide what can actually be monetized.
-
What most models miss: Portfolio structure and regulatory fit now move outcomes more than cell price changes, because a constrained site that cannot dispatch when prices spike cannot harvest the headline spreads.
-
Where it shows up first: Multi-site operators, logistics, light industry, cold chain, retail footprints, and data-adjacent loads where controllability and metering are already operationalized.
-
Decision implication: Underwriting needs to treat revenue stack eligibility and DSO rules as first-order risk, not a footnote, especially for debt comfort and DSCR resilience.
Why do forecasts go wrong in the EU C&I behind-the-meter BESS market?
Mechanism: Many forecasts treat flexibility value as universal and tradable, but behind-the-meter value depends on dispatch rights, metering design, export limits, and whether aggregation is permitted and practical.
Direction: As volatility rises and flexibility is politically prioritized, models expand revenue stacks, yet the realized stack can narrow when DSOs tighten connection terms, when settlement rules require more rigorous baselining, or when network charging reforms change incentives.
Where it shows up: Portfolios that under-deliver compared to pro forma, projects that look profitable only under perfect dispatch, and debt cases that fail once revenue verification is tested.
Decision implication: Underwrite eligibility first, price second.
Where do C&I behind-the-meter BESS projects fail in reality?
Mechanism: Failure typically comes from grid-interface and commercial-operating mismatches, not the battery hardware itself, because the asset’s value requires precise control, compliant metering, and dispatch that fits site operations.
Direction: As more projects chase the same flexibility signals, DSOs, aggregators, and counterparties raise the bar on telemetry, baseline integrity, and contractual clarity about who can dispatch and when.
Where it shows up: Delays at connection approval, metering rework, disputes over performance measurement, sites that refuse dispatch during operational peaks, and revenue leakage through poorly structured aggregator contracts.
Decision implication: Treat metering, dispatch authority, and operational constraints as critical-path diligence items.
How an IC team screens this market?
-
Confirm which revenue components are legally and practically accessible at each site, not in theory across the region.
-
Stress-test how DSO constraints, export limits, and network charging structures affect savings under adverse conditions.
-
Validate dispatch authority, telemetry readiness, and baseline methodology, because these decide whether revenues survive verification.
-
Underwrite counterparty quality and contract terms for aggregation, including curtailment rights and measurement disputes.
-
Model capex sensitivity, but prioritize operational controllability and settlement certainty for DSCR stability.
-
Check policy durability where flexibility schemes exist, but assume implementation varies materially by country and DSO.
-
Prefer portfolio strategies where repeatable compliance and controls reduce underwriting variance.
Market Dynamics
EU C&I Behind-the-Meter BESS Market 2026–2030: what actually drives outcomes
The demand pattern that matters is not “more batteries,” it is “more controllable load under tighter networks.” As electrification of heat, fleets, and processes increases coincident peaks, behind-the-meter storage becomes a tool to reshape site demand, but the direction of value differs by local tariff design and by how DSOs treat export, peak contribution, and flexibility services. This is why two similar factories in different member states can show radically different savings, even with identical hardware. Investors tend to underestimate this dispersion early, then over-correct by demanding generic discounts; the better move is to price the dispersion explicitly through a site-screening filter.
Supplier behavior is separating into two camps: equipment-led sellers who optimize around battery specs, and operating-model builders who optimize around dispatch quality, measurement, and repeatable compliance. That distinction becomes decisive by 2030 because regulators are increasingly formalizing flexibility needs assessments and support schemes, while simultaneously tightening the governance around market participation and consumer protection in flexibility. The signal to watch is not a glossy pipeline; it is which platforms consistently convert site permissions and telemetry into verifiable cashflows across multiple DSOs and settlement regimes. Recent EU policy work on flexibility and market design points in this direction, with member states expected to assess flexibility needs and potentially deploy support mechanisms, but implementation will be uneven and that unevenness is investable if treated as a feature, not a nuisance.
In the UK, the policy conversation is explicitly grappling with how consumer-led flexibility participates and how market design evolves, which matters because behind-the-meter strategies depend heavily on participation rules and measurement integrity. In the EU, state-aid pathways can temporarily accelerate storage-related support in certain contexts, but that does not remove the need to underwrite the operational and regulatory plumbing that turns flexibility into settled value.
Driver Impact Table
|
IC-grade driver |
Directional impact and where it shows up |
Buyer/operator most affected |
Impact band on economics |
How we measure it in the pack |
|
Network charging structures that penalize peaks and reward controllability |
Savings concentrate where tariff design makes peak contribution expensive and where on-site peaks are predictable enough to shave without disrupting operations |
Multi-site operators, industrials, retail footprints |
High |
Country-by-country tariff feature mapping, plus site archetype fit scoring |
|
DSO constraints and connection terms shaping usable dispatch |
Monetizable flexibility narrows where export limits, connection conditions, or DSO curtailment practices restrict dispatch during high-value periods |
Investors, banks, EPCs |
High |
“Dispatch-rights” checklist, DSO rule taxonomy, and constraint-adjusted value stack index (2024=100) |
|
Aggregation and participation pathways for demand-side flexibility |
Revenues improve where aggregation is operationally mature and where baselining and telemetry requirements can be met without constant disputes |
Developers, OEMs with platforms, IC teams |
Medium to High |
Aggregator-market structure assessment, verification friction scoring, and contract-risk flags |
|
Behind-the-meter coupling with on-site PV and electrified loads |
Value rises where storage reduces self-consumption losses, manages ramps, and protects operations from price spikes or network events |
Asset owners, operators |
Medium |
Archetype models for PV-coupled and process-load sites, including controllability and curtailment exposure |
|
Policy and funding channels that reduce friction for flexibility |
Adoption accelerates where policy reduces administrative burden and clarifies participation, but outcomes remain country-specific |
Investors, OEMs, EPCs |
Medium |
Policy-to-implementation tracker, with “bankability flags” rather than headline announcements |
Drag Impact Table
|
IC-grade drag |
Directional impact and where it shows up |
Buyer/operator most affected |
Impact band on economics |
How we measure it in the pack |
|
Metering, baselining, and settlement complexity |
Projects lose value when measurement disputes, telemetry gaps, or baseline rules reduce paid performance or trigger claw backs |
Banks, IC teams, aggregators |
High |
Measurement readiness scorecard, settlement-risk taxonomy, and diligence red flags |
|
Operational constraints that prevent dispatch when value peaks |
Realized capture falls where sites prioritize continuity and refuse dispatch during production or logistics peaks |
Operators, investors |
High |
“Operational override” probability bands by site archetype and sector |
|
DSO variability and slow administrative cycles |
Timelines extend and design changes rise where local DSO processes are slow or inconsistent, affecting commissioning and revenue start |
EPCs, developers, banks |
Medium to High |
DSO process map, indicative timeline bands, and rework risk scoring |
|
Contract structure that misaligns dispatch rights and incentives |
Performance degrades when the party paid for performance is not the party controlling dispatch decisions |
Investors, asset owners |
Medium to High |
Contract archetype library with failure modes and mitigation clauses |
Opportunity Zones & White Space
-
Portfolio-first strategies in fragmented regulatory terrain
Value is increasingly won by teams that treat EU-27 + UK as a set of distinct rulebooks and build a portfolio that optimizes for compliance and dispatch control rather than chasing the biggest single-site savings. You see this where multi-country operators standardize metering and controls, then selectively enable revenue stacks country by country; the decision implication is that scale is real only if it is operational scale, not procurement scale. -
“Network reality” opportunities in constrained urban and peri-urban feeders
Where DSOs face local constraints, behind-the-meter assets that reduce peaks and improve site behavior become more attractive, but only when the project is engineered around the connection agreement rather than bolted on later. This shows up in projects that are approved and commissioned without repeated redesign; the decision implication is that diligence must include DSO-interface design early, not as a permitting afterthought. -
Industrial controllability niches that look boring but underwrite well
Cold storage, light manufacturing, and process loads with predictable patterns can deliver dependable peak management, especially when dispatch does not interfere with operations. The direction is toward bankable savings rather than heroic market revenues; you see it in debt-friendly cases where performance is verifiable and less exposed to policy interpretation. -
Data-adjacent loads where power quality and continuity trump headline spreads
Sites that value resilience, power-quality management, and controllable demand can justify storage even when arbitrage is not the main story. This shows up where operational KPIs translate into financial KPIs; the decision implication is that underwriting should price avoided operational losses qualitatively, but keep market revenue assumptions conservative. -
Integration gap between hardware delivery and revenue verification
White space sits in the layer that converts telemetry and dispatch logs into settlement-grade evidence. As verification standards tighten, teams that can evidence performance cleanly become the ones that can finance at better terms; the decision implication is that “software and measurement discipline” is now a financing input, not a nice-to-have.
Market Snapshot – By Ownership, System size & Application stack
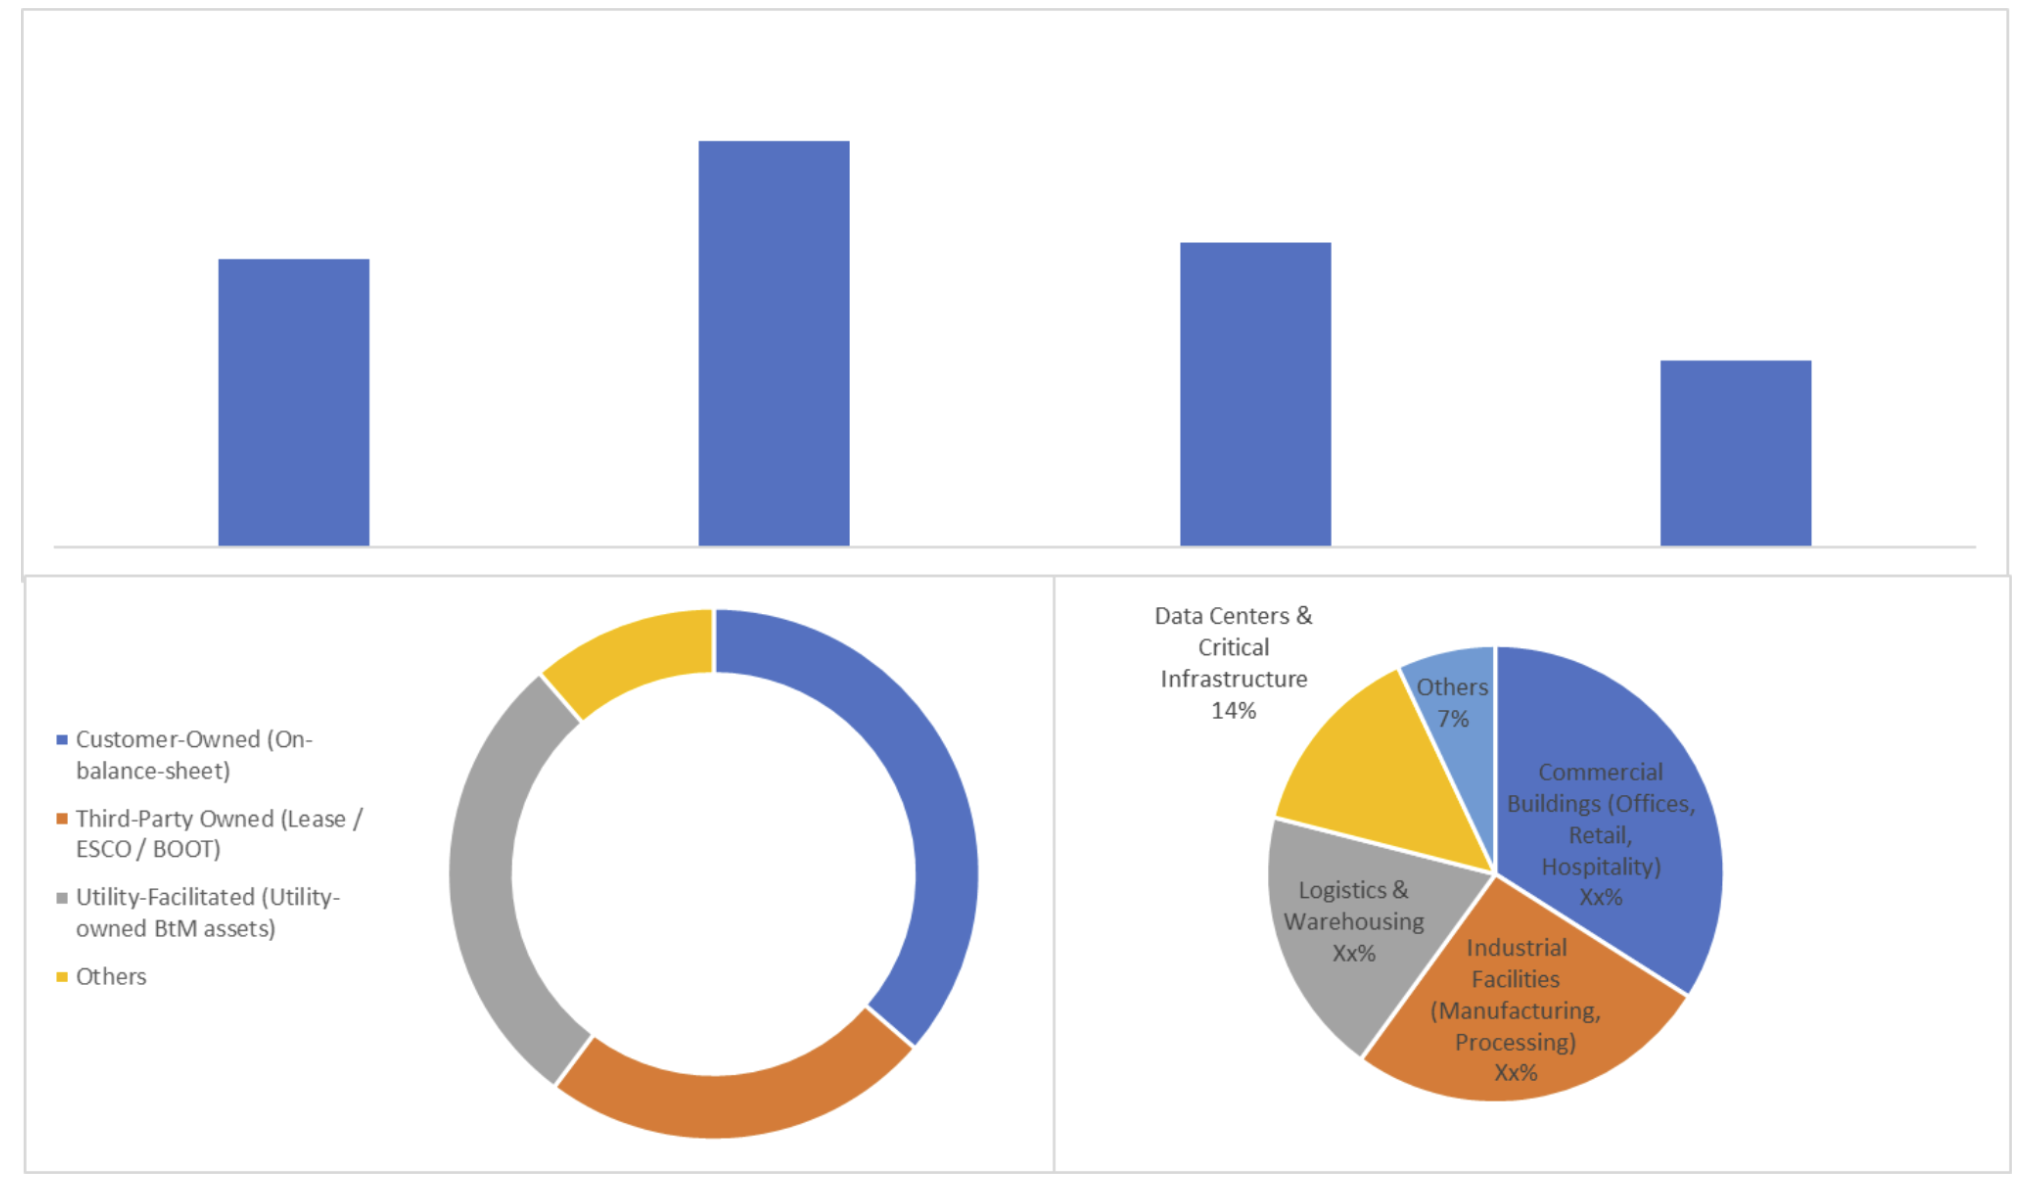
Source: Proprietary Research & Analysis
Mini Case Pattern
Pattern: From diligence to cashflow, where this market surprises teams
A multi-site logistics and cold-chain operator deploys behind-the-meter storage alongside existing electrified refrigeration and a mix of on-site generation. Diligence assumes peak shaving plus a meaningful flexibility revenue layer via aggregation, with dispatch scheduled around day-ahead price signals. In execution, the DSO connection terms limit export behavior and the metering configuration requires rework before performance can be verified at the standard the aggregator needs for settlement. The exact friction point is not hardware, it is dispatch rights and measurement governance: the site keeps overriding dispatch during operational peaks, and baseline rules reduce credited performance in the months that matter.
IC implication: underwrite revenue stacks only after dispatch authority and metering are contractually locked.
Bank implication: covenant comfort moves with verification clarity, not with battery warranty language.
Operator implication: define override rules and KPIs upfront or realized value will drift.
Competitive Reality
Competitive advantage in this market is shifting from “who can sell and install batteries” to “who can repeatedly monetize and evidence flexibility across DSOs and settlement regimes.” Gaining-share archetypes are those that combine site acquisition with controls, telemetry discipline, and contract structures that align dispatch rights with performance risk. Losing-relevance archetypes are equipment-only plays that treat revenue as a simple add-on, because buyers and lenders increasingly test whether performance can be proven and whether savings persist after tariff or rule changes.
Capital tends to favor platform-like operators and integrators when they can demonstrate low variance in outcomes across a portfolio, because variance is what breaks underwriting. The quiet winners are often those who reduce the cost of compliance and verification rather than those who claim the highest gross value. The signal to watch is repeatable settlement performance and low dispute rates, not pipeline size.
Strategy pattern table
|
Winning play |
Who uses it (archetype) |
Why it works |
Where it fails |
What signal to watch |
|
Portfolio standardization of metering, controls, and dispatch governance |
Multi-site platform builders |
Reduces outcome variance and makes revenues verifiable |
Fails when local DSOs require bespoke treatments that break standardization |
Percentage of sites passing “settlement-ready” checks on first attempt |
|
Contract structures that lock dispatch authority and override rules |
Investor-led asset owners |
Aligns incentives and protects cashflow integrity |
Fails when site operations refuse contractual constraints |
Frequency of operational overrides during high-value hours |
|
Country-by-country revenue stack enablement roadmap |
Specialist developers |
Avoids over-promising and matches rules to sites |
Fails when regulatory timelines slip and teams assume uniformity |
Time from commissioning to first settled flexibility payment |
|
Conservative market revenue, aggressive savings verification |
Debt-friendly originators |
Improves DSCR stability and reduces covenant stress |
Fails if tariff reforms remove savings edge |
Share of value coming from verified network/peak savings |
|
DSO-interface engineering as an early diligence gate |
EPC-integrator hybrids |
Reduces redesign and timeline risk |
Fails when DSO engagement is treated as paperwork |
Rate of connection-condition-driven redesign events |
Key M&A Deals:
-
TotalEnergies acquired the leading German BtM/VPP specialist Kyon Energy, significantly strengthening its C&I aggregation, flexibility services, and hybrid solar + storage offering across Europe.
-
Engie purchased a ready-to-build 52 MW BtM project from ReFeel New Energy (SUSI Partners) complete with a 15-year capacity market contract, targeting large C&I customers.
-
S4 Energy acquired TerraOne’s C&I-focused BtM portfolio and development pipeline, expanding its hybrid storage and demand-response capabilities in the German market.
-
Momentum Environmental bought selected assets from ESG, enhancing its C&I environmental services and behind-the-meter energy storage solutions.
-
Goldman Sachs acquired Liquid Environmental Solutions from Audax PE, adding liquid waste-to-energy management capabilities that complement C&I BtM storage and peak-shaving services.
Key Private Equity Deals:
-
ICG European Infrastructure formed a strategic partnership to deploy up to €500 million in a multi-gigawatt hybrid/C&I BtM platform, targeting commercial and industrial flexibility services.
-
Cube IM secured €150 million to accelerate its CubIKS solar + BESS platform, specifically designed for C&I self-consumption and peak-shaving applications (1 GW target).
-
MFT Energy took majority ownership in Northium Energy, a BtM developer specialising in C&I grid flexibility, demand response, and behind-the-meter storage solutions.
-
InfraVia backed GIGA Storage, a fast-growing C&I BtM platform focused on large commercial and industrial customers across Benelux and Germany.
-
Ares invested in Eni’s renewable and mobility unit, which includes significant C&I BtM BESS and flexibility offerings for industrial clients.
Recent Developments:
-
C&I BtM BESS additions reached 2.3 GWh in 2025, driven by corporate decarbonisation targets and peak-shaving economics, though the segment still accounts for only ~8–10% of total EU BESS deployments.
-
The nationwide smart-meter mandate enabled C&I users to participate in VPPs and ancillary services for the first time, boosting BtM adoption and allowing sub-100 kW systems to monetise flexibility.
-
Greece introduced a €154 million dedicated C&I storage programme; Austria, Czechia, and Poland rolled out subsidies and tax breaks specifically for commercial and industrial behind-the-meter systems in 2025.
-
C&I operators increasingly pair rooftop solar with BtM storage to achieve Scope 2 reductions and improve grid-connection prospects, with hybrid projects now representing the majority of new C&I installations in Germany, Netherlands, and Italy.
-
The 2025 Flexibility Package and Energy Efficiency Directive updates harmonised demand-response rules and allowed C&I BtM systems to participate in capacity markets and dynamic tariffs, significantly improving project bankability and merchant viability.
Capital & Policy Signals (Deal-Screen Useful)
Policy direction across Europe increasingly recognizes flexibility as a system need, but behind-the-meter outcomes will still be determined locally because DSOs and national market rules control participation and settlement pathways. EU electricity market design work and flexibility needs assessments point toward more structured treatment of non-fossil flexibility over time, which supports the investment case in principle, yet it also raises the bar on measurement and governance, which is where weaker projects get filtered out.
In the UK, market design discussions and government work on flexibility underscore that participation frameworks evolve, and that evolution can reprice revenue certainty. The practical implication for IC teams is to discount narrative and underwrite rule implementation and verification pathways. For banks, the key is whether cashflows are measurable and enforceable, not whether volatility exists.
Decision Boxes
IC/Investor Decision Box: Underwriting thresholds that actually move IC memos
Mechanism: dispatch rights and settlement rules decide which revenues exist.
Where it shows up: pro formas with high spreads but low realised capture.
Decision implication: price portfolios on verified controllability, not headline volatility.
Bank Decision Box: What changes DSCR and covenant comfort first
Mechanism: cashflows depend on verifiable savings and settled flexibility payments. Direction: measurement disputes and overrides raise volatility of net cash.
Where it shows up: weak months triggering covenant anxiety.
Decision implication: require evidence-grade metering, clear baselines, and conservative revenue stacking.
OEM Decision Box: Where specs, retrofits, and compliance budgets really shift
Mechanism: DSO and settlement requirements pull hardware and controls into higher telemetry and safety expectations.
Direction: compliance spend rises relative to pure battery BOM decisions.
Where it shows up: retrofit costs, comms architecture, and testing regimes.
Decision implication: design for verification and grid-interface acceptance from day one.
EPC Decision Box: Where delivery risk hides (scope, LDs, commissioning, availability)
Mechanism: connection terms and metering design drive redesign and commissioning delays.
Direction: delivery risk migrates from construction to interface scope and documentation. Where it shows up: late-stage changes, LD exposure, and delayed revenue start.
Decision implication: treat DSO-interface scope as critical-path and price it accordingly.
Operator Decision Box: What breaks in O&M and how it hits availability and opex
Mechanism: dispatch conflicts with operations and degrades cycle planning.
Direction: unplanned overrides and conservative dispatch reduce value and increase operational friction.
Where it shows up: lower availability for revenue events and higher troubleshooting load. Decision implication: define operational guardrails and incentives, then automate compliance monitoring.
Methodology Summary
Forecasts in this pack are built from a bottom-up model of behind-the-meter value stacks by country cluster, then stress-tested through operational and regulatory feasibility filters rather than assumed market-wide eligibility. We start with use-case archetypes (peak management, self-consumption optimization, flexibility participation via aggregation where applicable), apply local grid-interface constraints and metering requirements, and then convert the result into investable bands using conservative, verification-first assumptions.
We use public policy and regulatory materials to anchor what is allowed, what is changing, and what is likely to remain implementation-fragmented across EU-27 + UK. EU-level market design and flexibility framing informs the direction of travel, while national and DSO realities determine addressability. State-aid pathways are treated as optional accelerants, not as the base case, because support is time-bound and uneven.
Analyst credibility box
We write this pack as an underwriting aid, not a marketing artefact: mapping what can be monetized, what cannot, and why outcomes vary by site and rulebook. In this market, the hardest items to verify consistently are dispatch rights, baseline integrity, and how DSO constraints translate into realized capture.
Limitations box
-
Local DSO practices can diverge from national intent, so feasibility is screened using constraint bands, not certainty.
-
Flexibility participation rules can evolve quickly, and implementation timing is rarely uniform across countries.
-
Site operations can override dispatch for good reasons, so operational behavior is treated as a risk factor, not assumed away.
-
Revenue verification and settlement disputes are difficult to predict; we mitigate this with contract and metering readiness scoring.
What changed since last update
-
Flexibility policy framing increasingly emphasizes structured needs assessments and non-fossil flexibility pathways at EU level.
-
UK policy work continues to refine consumer-led flexibility participation, with implications for revenue certainty and measurement discipline.
-
State-aid transition tools remain relevant as accelerants in some contexts, but are treated as scenario levers, not base case.
Source Map
-
European Commission electricity market design materials and related implementing context
-
EU market design reform and flexibility needs assessment framing (policy interpretation layer)
-
National energy regulators’ network charging and flexibility participation rules
-
DSO connection guidance, export constraints, and metering requirements by country
-
Aggregator participation rules, baseline methodologies, and telemetry standards
-
Capacity and flexibility market documentation where relevant, including UK materials
-
Public tender frameworks and utility procurement signals for flexibility services
-
Battery safety standards and permitting requirements applicable to C&I installations
-
Project disclosures, investor presentations, and audited filings where available
-
Industry associations’ regulatory briefs and implementation watchpoints
-
State-aid frameworks relevant to storage as an enabling lever
-
Grid constraint indicators and publicly available queue or congestion signals where published
Why This Reality Pack Exists
Generic syndicated reports usually treat behind-the-meter storage as a single market with a single value stack. That approach misses the real problem: addressability is determined by local rulebooks, and outcomes depend on whether flexibility can be dispatched, measured, and settled without dispute. This pack exists to replace headline narratives with underwriting-grade filters: what is monetizable by country and site type, where revenue claims collapse under DSO constraints, and how to structure portfolios so performance survives verification. For decision teams, the point is not to chase optimistic totals; it is to avoid false precision and build directional confidence where capital is actually at risk.
What You Get
-
80–100 slide PDF designed as IC-ready material, with decision screens, risk bands, and country-cluster logic that can be lifted into memos.
-
Excel Data Pack
-
20-minute analyst Q&A focused on your specific portfolio thesis, underwriting assumptions, and what would change our view.
-
12-month major-policy mini-update covering only changes that materially alter addressability, bankability, or revenue-stack eligibility.
Snapshot: EU C&I Behind-the-Meter BESS Market 2025–2030
Installed base is best understood as uneven and policy-shaped across EU-27 + UK, with concentration where C&I sites face meaningful peak exposure and where operational controllability is already mature, which is why multi-site footprints often scale faster than single flagship projects. Growth through 2030 is likely to be driven less by a uniform “market boom” and more by the spread of repeatable playbooks that convert tariff-driven savings and permitted flexibility participation into settled value. Policy levers increasingly talk about flexibility as a system need, but the operational reality is that DSOs and settlement rules decide what a behind-the-meter asset can actually do, so the risk band for any project is set by dispatch rights and measurement governance. Operationally, the next five years matter because verification standards and grid constraints are tightening at the same time, and that combination rewards teams who design for compliance and controllability rather than teams who optimize only for battery capex.
Sample: What the IC-Ready Slides Look Like
-
A 1-page IC decision summary that separates “theoretical value” from “eligible and verifiable value” by country cluster and site archetype.
-
A consensus versus reality chart showing how dispatch constraints and measurement rules compress the usable revenue stack even when volatility is favorable.
-
A risk and mitigants layout that treats metering, baselines, and dispatch authority as first-order diligence items.
-
An opportunity map that highlights portfolio-first strategies and controllability niches rather than generic sector excitement.
-
Deal-screen criteria that an IC team can lift directly into an investment memo, including dispatch-rights scoring and verification readiness.
-
A sensitivity table expressed in bands, showing which variables move DSCR comfort first, without pretending point precision.
-
A pipeline heat snippet focused on rulebooks and readiness signals, not on headline project announcements.
Why Purchase This Report?
IC-Defensible Thesis, Not “Market Size”
A decision frame you can take into committee: boundary, base case, and what would change our view.
Evidence Ladder You Can Audit
Artefacts-led (grid offers, tenders, term-sheet structures, warranty language), mapped to what each proves and where it fails.
IRR Kill-Shots and Early Signals
The repeatable ways projects miss IRR (timeline, capex, availability, settlement): plus the first signals that show up before the slide.
Regime Classes and Dominant Variables
Why identical assets underperform in different environments: the one variable that dominates returns by regime (payer, settlement, constraints, curtailment logic.
Table of Contents
EU C&I Behind-the-Meter BESS Market 2026–2030
1. Executive Brief/Summary (What Everyone’s Missing)
1.1 Market Size & Forecast (2025–2030)
1.2 Where Most Forecasts Go Wrong and Where the Money’s Actually Going
1.3 High-Level Opportunity Snapshot
2. Research Architecture & Field Intelligence
2.1 Research Methodology & Data Sources
2.2 Top 3 Growth Signals from Market Stakeholders
2.3 Execution Friction: Where Projects Fail in Reality
3. Demand Outlook
3.1 Key demand drivers, focused on what changes decisions
3.2 Underserved Buyer Segments & Use Cases
3.3 Procurement and Pricing Patterns
4. Opportunity and White Space Map
4.1 Two Priority Segments to Watch
4.2.Regions / verticals with high pain, low competition
4.3. Integration Gaps and Pricing Bands that still work
4.4. Top Risks & Practical de-risk Levers
5. Competitive Intelligence: Strategic Benchmarking
5.1 Market Share Breakdown: Key Players (2024/25E)
5.2 Who’s Gaining Share, and Why (Talent, M&A, Policy Edge)
5.3 Challenger Playbook: How Smaller Players Are Quietly Winning
5.4. Company Profiles
5.4.1. Company 1
5.4.2. Company 2
5.4.3. Company 3
5.4.4. Company 4
5.4.5. Company 5
5.5. Capital flows:
5.5.1. By Investor Type (VC, PE, Infra, Strategics)
5.5.2. Investment Patterns, M&A, JV, and Expansion Moves
6. Market Segmentation
6.1 By Ownership & Deployment Model
6.1.1 Customer-Owned (On-balance-sheet)
6.1.2 Third-Party Owned (Lease / ESCO / BOOT)
6.1.3 Utility-Facilitated (Utility-owned BtM assets)
6.1.4 Others
6.2 By Application Stack (Primary Value Use)
6.2.1 Self-Consumption & Solar PV Coupling
6.2.2 Peak Shaving & Demand Charge Management
6.2.3 Backup Power & Resilience
6.2.4 Grid Services Participation (Implicit / Contracted)
6.2.5 Others
6.3 By System Size (Usable Capacity)
6.3.1 ≤100 kWh
6.3.2 101–500 kWh
6.3.3 501 kWh–1 MWh
6.3.4 >1 MWh
6.3.5 Others
6.4 By End-User Type
6.4.1 Commercial Buildings (Offices, Retail, Hospitality)
6.4.2 Industrial Facilities (Manufacturing, Processing)
6.4.3 Logistics & Warehousing
6.4.4 Data Centers & Critical Infrastructure
6.4.5 Others
6.5 By Geography
6.5.1 Germany
6.5.2 France
6.5.3 Italy
6.5.4 Spain
6.5.5 Netherlands
6.5.6 Rest of Europe
7. Action Frameworks for 2025–2028
7.1 Market Entry Options by Archetype (Builders, Tech Entrants, Investors)
7.2 Three realistic GTM Patterns
7.3 Strategic Watchlist: What to Monitor Quarterly
8. IC-Ready Decision Pack (Slides You Can Reuse Directly)
8.1. One-page IC Summary (yes/no, where, how)
8.2. 4-5 IC slides you can re-use (market thesis, risk & mitigants, competition)
8.2. Cheat sheets
8.4 Country / Segment Prioritization Slide
8.5 “Go / No-Go” Checklist for 2025–2028
Appendix: Reference Frameworks & Background:
-
A1. Regulatory overview (high-level, with links to primary docs)
-
A2. PESTLE snapshot
-
A3. Porters (one slide max, if at all)
-
A4. Supply chain maps
-
A5. Price band tables
------------------------------------------------------------------------------------------------------------------
EU Green Hydrogen (Electrolyser + Offtake) Market 2026–2030
1. Executive Brief/Summary (What Everyone’s Missing)
1.1 Market Size & Forecast (2025–2030)
1.2 Where Most Forecasts Go Wrong and Where the Money’s Actually Going
1.3 High-Level Opportunity Snapshot
2. Research Architecture & Field Intelligence
2.1 Research Methodology & Data Sources
2.2 Top 3 Growth Signals from Market Stakeholders
2.3 Execution Friction: Where Projects Fail in Reality
3. Demand Outlook
3.1 Key demand drivers, focused on what changes decisions
3.2 Underserved Buyer Segments & Use Cases
3.3 Procurement and Pricing Patterns
4. Opportunity and White Space Map
4.1 Two Priority Segments to Watch
4.2.Regions / verticals with high pain, low competition
4.3. Integration Gaps and Pricing Bands that still work
4.4. Top Risks & Practical de-risk Levers
5. Competitive Intelligence: Strategic Benchmarking
5.1 Market Share Breakdown: Key Players (2024/25E)
5.2 Who’s Gaining Share, and Why (Talent, M&A, Policy Edge)
5.3 Challenger Playbook: How Smaller Players Are Quietly Winning
5.4. Company Profiles
5.4.1. Company 1
5.4.2. Company 2
5.4.3. Company 3
5.4.4. Company 4
5.4.5. Company 5
5.5. Capital flows:
5.5.1. By Investor Type (VC, PE, Infra, Strategics)
5.5.2. Investment Patterns, M&A, JV, and Expansion Moves
6. Market Segmentation
6.1 By Electrolyser Technology
6.1.1 Alkaline Electrolysers (AEL)
6.1.2 Proton Exchange Membrane (PEM)
6.1.3 Solid Oxide Electrolysers (SOEC)
6.1.4 Anion Exchange Membrane (AEM)
6.1.5 Others
6.2 By Project Capacity Scale
6.2.1 Small-Scale (<10 MW)
6.2.2 Medium-Scale (10–100 MW)
6.2.3 Large-Scale (100–500 MW)
6.2.4 Gigawatt-Scale (>500 MW)
6.2.5 Others
6.3 By Offtaker Industry
6.3.1 Refining
6.3.2 Chemicals & Ammonia
6.3.3 Steel & Metals
6.3.4 Power Generation & Energy Storage
6.3.5 Mobility & Transport
6.3.6 Others
6.4 By Offtake Contract Structure
6.4.1 Long-Term Fixed Price Contracts
6.4.2 Index-Linked / Variable Price Contracts
6.4.3 Merchant / Spot Sales
6.4.4 Hybrid (Contract + Merchant)
6.4.5 Others
6.5 By Geography
6.5.1 Germany
6.5.2 Spain
6.5.3 France
6.5.4 Netherlands
6.5.5 Rest of Europe
7. Action Frameworks for 2025–2028
7.1 Market Entry Options by Archetype (Builders, Tech Entrants, Investors)
7.2 Three realistic GTM Patterns
7.3 Strategic Watchlist: What to Monitor Quarterly
8. IC-Ready Decision Pack (Slides You Can Reuse Directly)
8.1. One-page IC Summary (yes/no, where, how)
8.2. 4-5 IC slides you can re-use (market thesis, risk & mitigants, competition)
8.2. Cheat sheets
8.4 Country / Segment Prioritization Slide
8.5 “Go / No-Go” Checklist for 2025–2028
Appendix: Reference Frameworks & Background:
-
A1. Regulatory overview (high-level, with links to primary docs)
-
A2. PESTLE snapshot
-
A3. Porters (one slide max, if at all)
-
A4. Supply chain maps
-
A5. Price band tables
Research Methodology
No research methodology information available for this report.
Frequently Asked Questions
Research Grounded in Verifiable Inputs
Our research draws on publicly verifiable inputs including regulatory filings, grid operator data, project announcements, and policy documents across Europe.
These inputs are cross-checked through structured discussions with industry participants to validate what is progressing in practice versus what remains theoretical.
Analyst-Led Research Support
Each report is supported by analysts who focus on specific energy domains and regions. Clients can discuss assumptions, clarify findings, and explore implications with analysts who follow these markets on an ongoing basis
Energy Insights,
Straight to Your Inbox
For People Who Sign Off on Energy Decisions.
Short updates on EU power, grids, storage, and execution risk. No spam, just what matters.
Unsubscribe anytime. No spam, ever.